
|
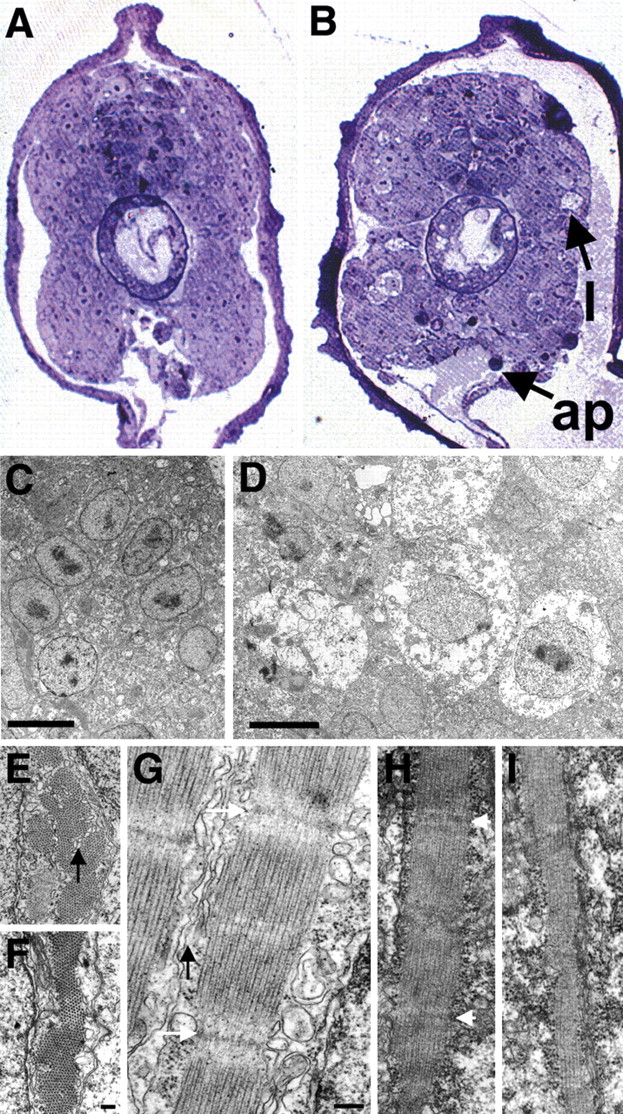
Fig. 4 Histological analysis of dystroglycan morphants. Sections of control MO-injected (A,C,E,G) and dystroglycan morphant (B,D,F,H,I) embryos, all at 28 hpf. (A,B) Light micrographs of transverse sections. l, lesions; ap, apoptotic cells. (C,D) Electron micrographs of transverse sections through muscle. Lesions seen in B are confirmed as swollen, necrotic cells shown in D. (E-I) Subcellular structure of muscle cells at higher magnification. (E,F) Typical hexagonal array of actin and myosin in transverse sections. (G-I) Longitudinal sections. Z-discs are indicated, where detected, by white arrows. In the few identifiable sarcomeres in dystroglycan morphants, muscle fibre organisation is disrupted and sarcoplasmic reticulum is difficult to discern (H). The majority of muscle fibres in dystroglycan morphants possessed no sarcomeres (I). Sarcoplasmic reticulum in control embryos is indicated by black arrows. Scale bars: 5 μm in C,D; in F, 0.2 μm for E,F; in G, 0.2 μm for G-I.