
|
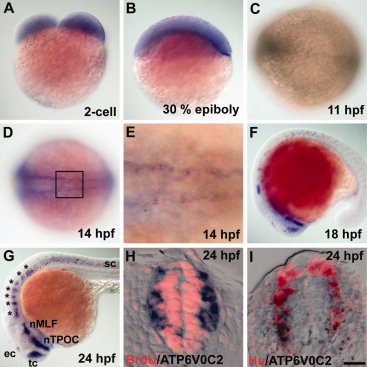
Fig. 2 atp6v0c2 expression revealed by in situ RNA hybridization. A, B: Lateral views of (A) 2-cell stage and (B) 30% epiboly-stage embryos, dorsal at the top. C, D: Dorsal view of the trunk region of 11-hpf (C) and 14-hpf (D) embryos, anterior to the left. E: High-magnification image of the boxed area in D. F, G: Lateral views of 18-hpf (F) and 24-hpf (G) embryos, anterior to the left. tc, telencephalic cluster; ec, epiphysial cluster; nTPOC, nucleus of the tract of the post optic commissare; nMLE, nucleus of the medial longitudinal fasciculus; sc, spinal cord. H, I: Transverse sections of the spinal cord of a 24-hpf embryo, dorsal at the top. H: Sections were processed by in situ hybridization with an atp6v0c2 RNA probe and subsequent labeled with anti-BrdU antibody (red staining). I: Sections were processed by in situ hybridization with an atp6v0c2 RNA probe and subsequent labeling with anti-Hu antibody (red staining). Scale bar: A–D, F, G, 80 μm; E, H, I, 20 μm.