
|
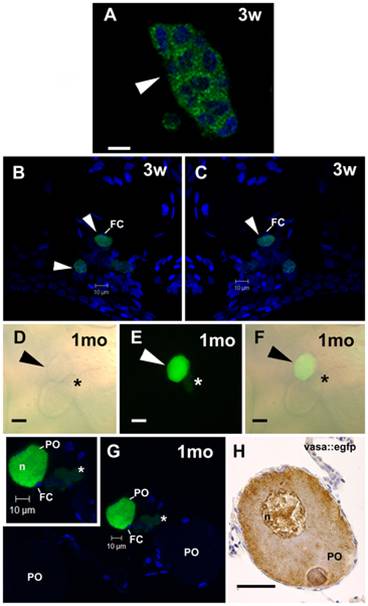
Fig. 6 SSC transplantation into female zebrafish recipients analyzed under CLSM.
A. A GFP cell cluster-derived from transplanted SSC after three weeks (3w) of transplantation. Nuclei (blue) are stained with DAPI. Scale bar = 10 μm. B,C. Arrowhead indicates an early donor-derived oocytes surrounded by follicle cells (FC) after three weeks (3w) of transplantation. Nuclei (blue) are stained with DAPI. D–F. Arrowhead indicates an advanced GFP oocyte, which was originated from transplanted SSC into zebrafish ovaries after one month (1mo) of transplantation. Note a small GFP cell cluster (asterisk) near the donor-derived oocyte. Light (D) and fluorescence (E) microscopies, and overlay of both (F). Scale bars = 25 μm. G. The same oocyte in D–F examined under CLSM. A green donor-derived perinucleolar oocyte (PO), endogenous perinucleolar oocyte (PO), small GFP cell cluster (asterisk), and nucleus (n) are shown. Inset. High magnification of advanced donor-derived oocyte. Nuclei (blue) are stained with DAPI. H. Perinucleolar oocyte from vasa::egfp ovaries immunostained for gfp. Compare similar vasa expression pattern between donor-derived oocyte and perinucleolar oocyte from vasa::egfp ovaries. Scale bar = 25 μm.