
|
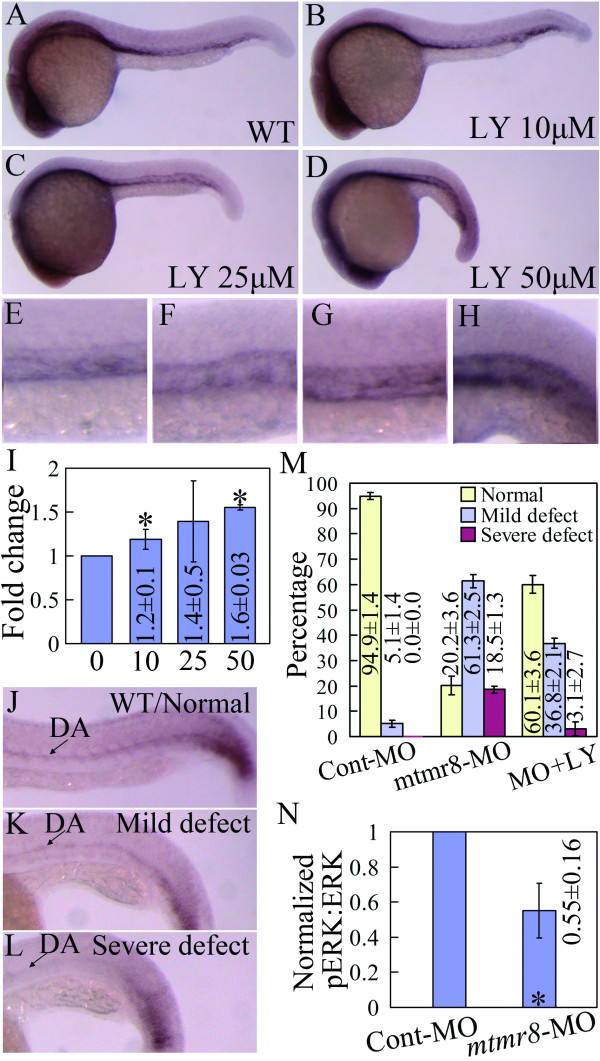
Fig. 5 Mtmr8 negatively regulates the PI3K/Akt pathway. (A-D) Mtmr8 expression in wild type (WT) embryo (A) and the treated embryos (C-D) with different doses of LY294002 (LY) at 26 hpf. (E-H) The corresponding amplification of A-D, showing the detailed changes in the trunk vasculature. (I) Mtmr8 expression changes revealed by Q-RT-PCR in embryos treated with different doses of LY294002 (μM). (J-L) Three phenotypes of ephrinB2a expression and quantification data (M) in 26 hpf Mtmr8 morphants (30 embryos in each experiment group). (N) Quantitative Western blot data of ERK phosphorylation in 20-somite Mtmr8 morphants. * Indicates significance of p < 0.05.