
Image
|
Figure Caption
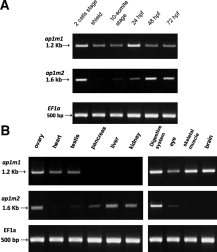
Fig. 4 ap1m1 and ap1m2 expression during development and in adult organs. Expression analysis by RT-PCR. α-Elongation Factor served as positive control. A: ap1m1 and ap1m2 expression during zebrafish development from 2 cells to 72 hpf. B: ap1m1 and ap1m2 expression pattern in adult organs.
Figure Data
Acknowledgments
This image is the copyrighted work of the attributed author or publisher, and
ZFIN has permission only to display this image to its users.
Additional permissions should be obtained from the applicable author or publisher of the image.
Full text @ Dev. Dyn.