
|
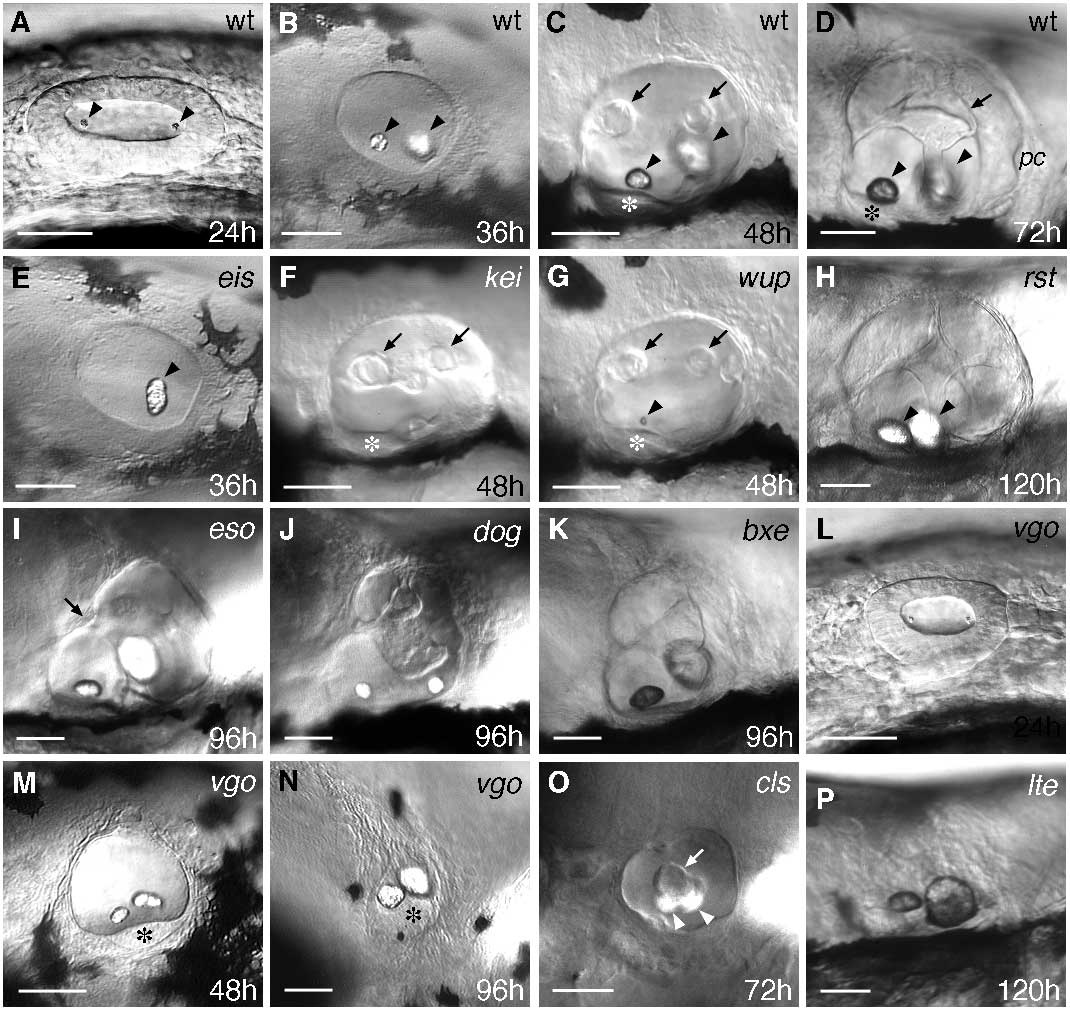
Fig. 2 DIC images showing the ear phenotypes of live mutants. (A-D) Lateral views of wild-type (wt) ears, for comparison with the mutant phenotypes. Ages are given in hours (h) for each image. From 72-120 hours, the appearance of the ear does not change much, although the vesicle and otoliths increase in size (see Fig. 1 for appearance of the ear at 96 hours, with explanatory diagram). (B-P) Selected examples of the mutant phenotypes. Gene names and ages are shown for each image; see text for details. Arrowheads indicate otoliths; arrows mark epithelial projections in the ear which form the semicircular canals. Asterisks indicate the anterior sensory macula. pc, posterior crista. Scale bars, 50 μm.