
|
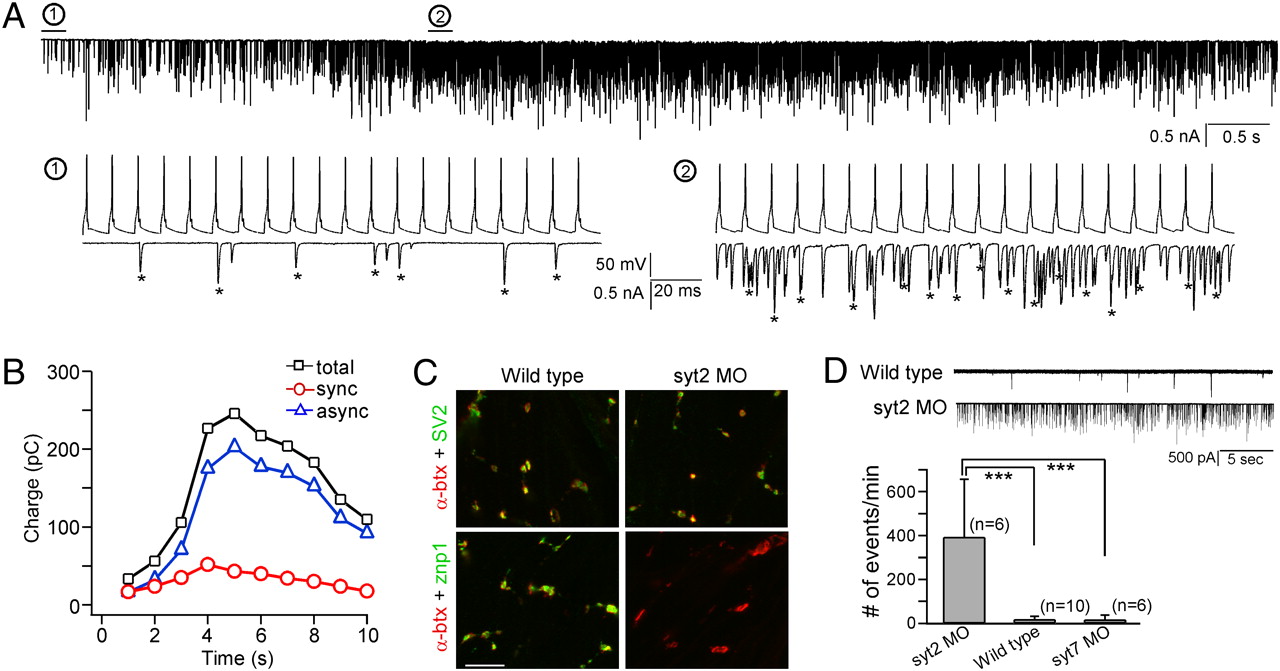
Fig. 3 Effects of syt2 knockdown on release. (A) The 10-s train of EPCs in response to 100-Hz stimulation for a syt2 morpholino fish. Two regions are expanded on a fast time scale corresponding to times when, in wild-type fish, release is either largely synchronous (A1) or asynchronous (A2). Asterisks indicate EPCs considered to be synchronous. The increased frequency of synchronous events in A2 is likely due to the heightened probability that an asynchronous event will fall within the window defined for synchronous detection. (B) Comparison of the contributions of asynchronous (blue triangles) versus synchronous (red circles) to total release (black squares) over the time course of 10 s of stimulation. (C) SV2 presynaptic label (green) and postsynaptic α-bungarotoxin (α-btx) label (red) in wild type (Upper Left) and syt2 morpholino (Upper Right) fish. Znp-1 antibody labeled syt2 protein (green) colocalizes with α-btx (red) label in wild-type fish (Lower Left) but is absent in syt2 morpholino fish (Lower Right). (Scale bar, 10 μm.) (D) Example traces of spontaneous synaptic currents from wild type (Top) and syt2 morpholino (Bottom) fish. A bar graph of spontaneous event frequency for wild-type fish (392 ± 263; n = 6 recordings), syt2 morpholino fish (18 ± 14; n = 10 recordings), and syt7 morpholino fish (17 ± 21; n = 6 recordings). ***P < 0.001.