
|
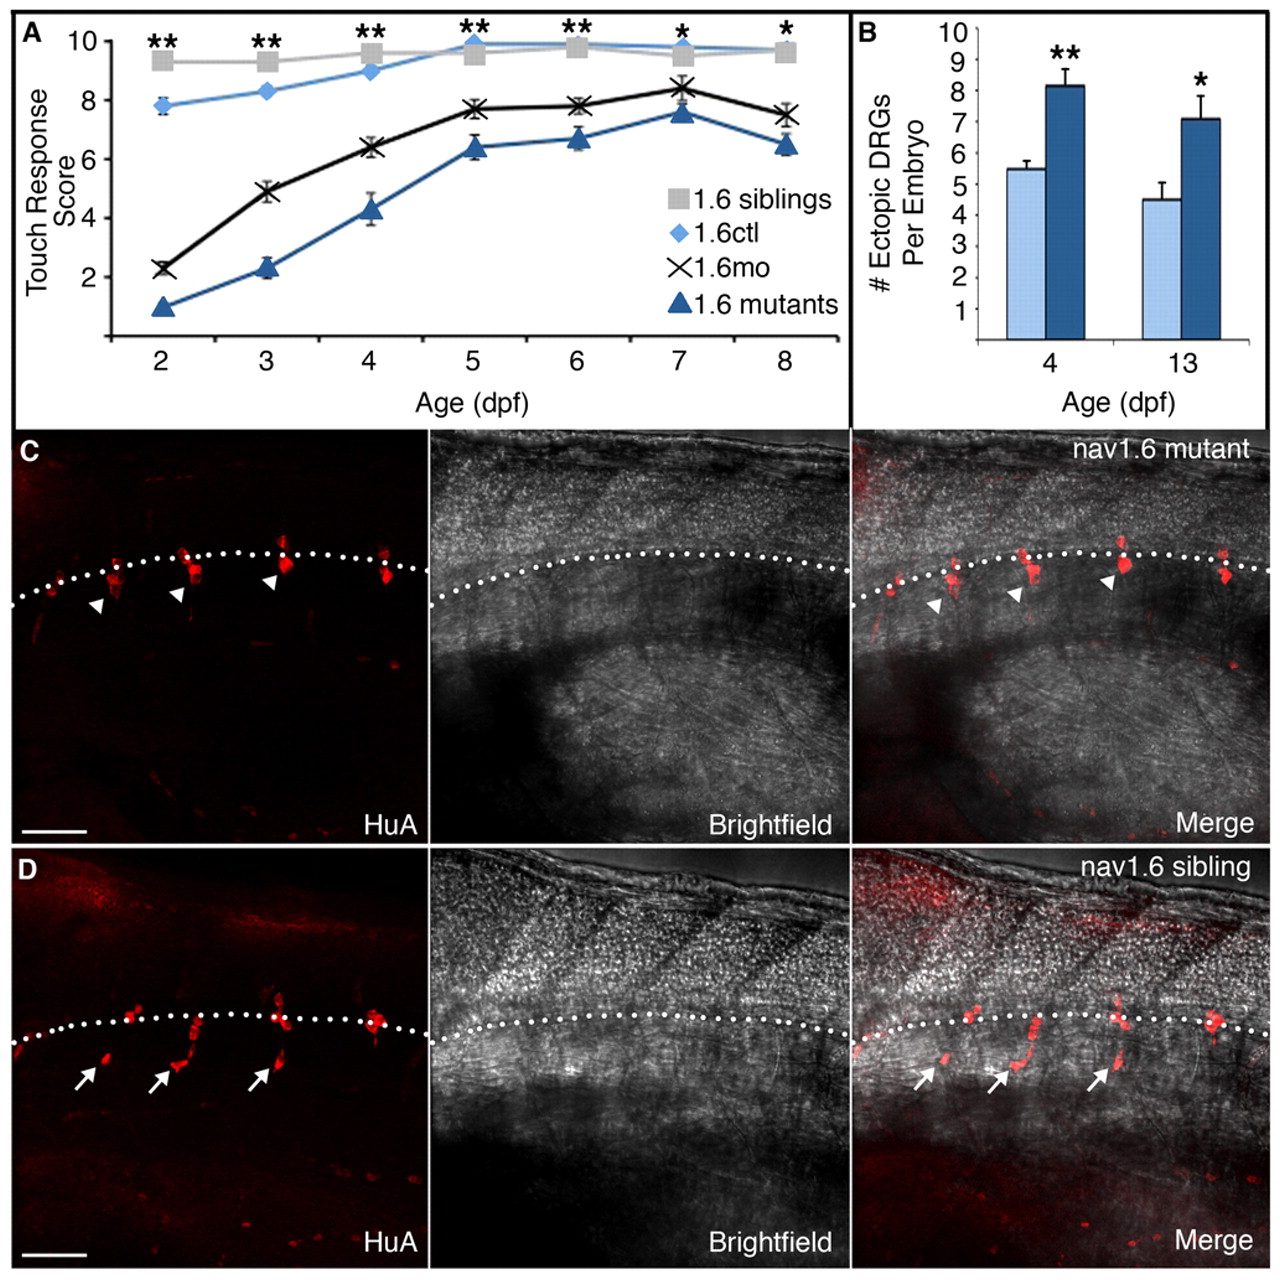
Fig. 6
nav1.6 mutants recapitulate the morphant phenotype. (A) nav1.6 morphants (black crosses) and mutants (dark-blue triangles) show a severe reduction in touch sensitivity at 2 dpf compared with control (gray squares) and sibling (light blue diamonds) embryos. Although nav1.6 morphants and mutants partially recover by 5 dpf, they show similar deficits in touch sensitivity that persist as late as 8 dpf (**P<0.001 for nav1.6 siblings and controls versus nav1.6 mutants and morphants; **P<0.01 for nav1.6 siblings and controls versus nav1.6 mutants and morphants; Kruskal-Wallis nonparametric ANOVA). (B) The increase in the number of ectopic DRG neurons in nav1.6 mutant versus control larvae persists to 13 dpf (**P<0.0001, *P=0.0105; Mann-Whitney test). Scale bars: 50 µm. (C) Additionally, whereas HuA-positive DRG neurons cluster lateral to the ventral spinal cord in nav1.6 siblings (arrowheads), (D) many individual DRG neurons in nav1.6 homozygous mutants are located ectopically, in more ventral positions (arrows) reminiscent of DRG position in nav1.6 morphants. The broken white line indicates the ventral boundary of the spinal cord.