
IMAGE
Fig. S2
- ID
- ZDB-IMAGE-100903-35
- Publication
- Dutta et al., 2010 - Kctd15 inhibits neural crest formation by attenuating Wnt/β-catenin signaling output
- All Figures
- Figures for Dutta et al., 2010
Image
|
Figure Caption
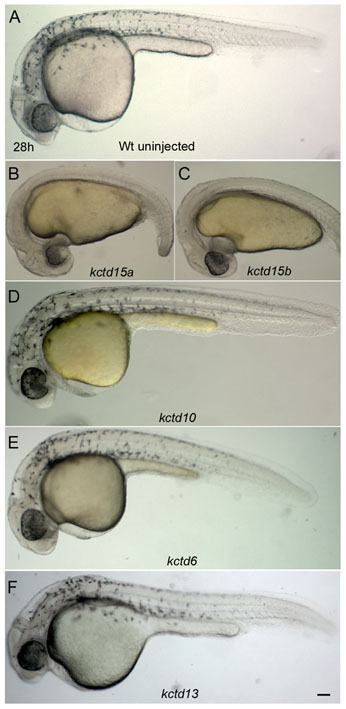
Fig. S2 Specificity of the kctd15 RNA overexpression phenotype. (A) Control embryos. (B-F) Embryos injected with kctd15a RNA (B, 36/50) or kctd15b RNA (C, 38/50) show loss of pigmentation, yolk extension and short tail, whereas embryos injected with kctd10 RNA (D, 48/50), kctd6 RNA (E, 46/50) and kctd13 RNA (F, 44/50) are largely normal and show unaffected pigmentation. Lateral views of 30 hpf live embryos. Scale bar: 100 μm.
Acknowledgments
This image is the copyrighted work of the attributed author or publisher, and
ZFIN has permission only to display this image to its users.
Additional permissions should be obtained from the applicable author or publisher of the image.
Full text @ Development