
Image
|
Figure Caption
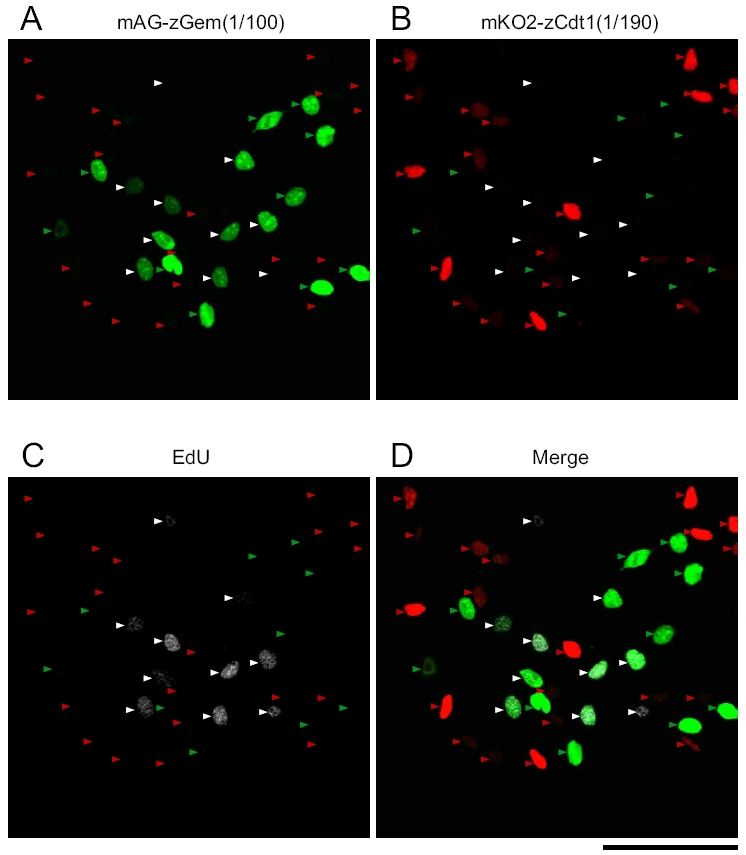
Fig. S3 Characterization of zFucci for cell cycle progression. (A–D) A wide field image of Cecyil cells expressing zFucci: mKO2-zCdt1(1/190) and mAG-zGem(1/ 100) and detection of incorporated EdU. Red, green, and white arrows indicate G1, S, and G2 phases, respectively. (Scale bar, 100 μm.)
Acknowledgments
This image is the copyrighted work of the attributed author or publisher, and
ZFIN has permission only to display this image to its users.
Additional permissions should be obtained from the applicable author or publisher of the image.
Open Access.
Full text @ Proc. Natl. Acad. Sci. USA