
|
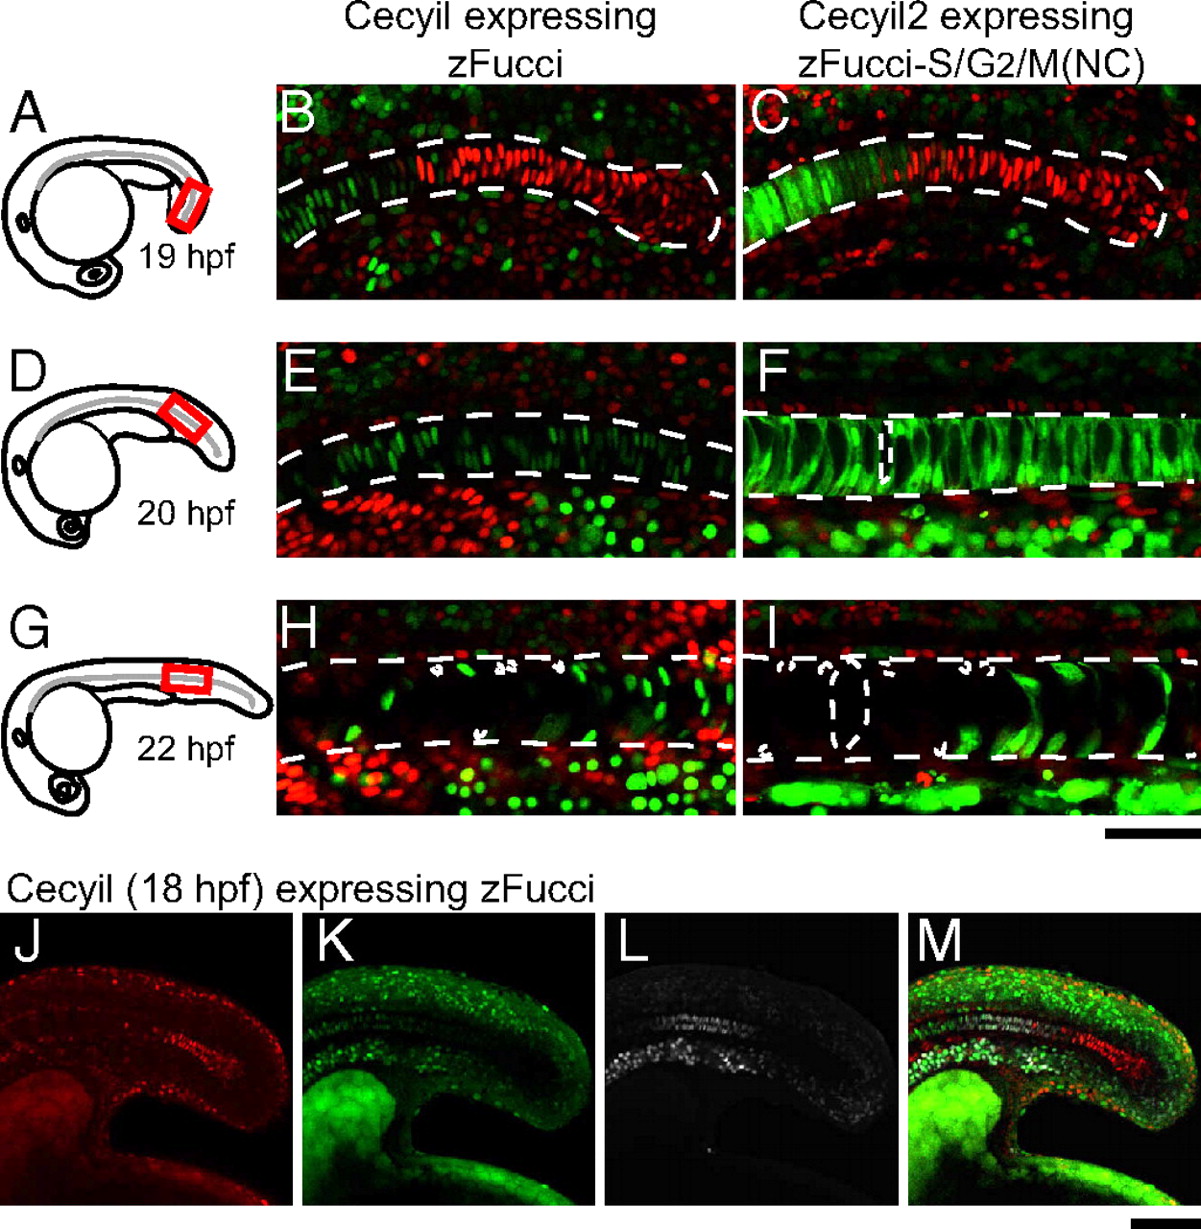
Fig. 3 Cell-cycle transition waves in the differentiating notochord. Dechorionated embryos at various stages were fixed in 4% paraformaldehyde (PFA) solution, then each sample was mounted in 0.3% agar so that a confocal image of the posterior region of the notochord could be obtained. (A) A schematic drawing of an embryo at 19 hpf. (B) A fluorescence image of the posterior region (indicated in A) of the notochord of a Cecyil embryo at 19 hpf. (C) A fluorescence image of the posterior region (indicated in A) of the notochord of a Cecyil2 embryo at 19 hpf. (D) A schematic drawing of an embryo at 20 hpf. (E) A fluorescence image of the posterior region (indicated in D) of the notochord of a Cecyil embryo at 20 hpf. (F) A fluorescence image of the posterior region (indicated in D) of the notochord of a Cecyil2 embryo at 20 hpf. (G) A schematic drawing of an embryo at 22 hpf. (H) A fluorescence image of the posterior region (indicated in G) of the notochord of a Cecyil embryo at 22 hpf. (I) A fluorescence image of the posterior region (indicated in G) of the notochord of a Cecyil2 embryo at 22 hpf. (J–M) A Cecyil embryo at 18 hpf was treated with 400 μM EdU for 1 h and then fixed with 4% PFA. Alexa647-azide was used to visualize EdU incorporation. Fluorescence images of the notochord of a Cecyil embryo at 18 hpf for G1 marker (red) (J), S/G2/M marker (green) (K), incorporated EdU (white) (L), and their merge (M). [Scale bar, 50 μm (A–I); 100 μm (J–M.]