
|
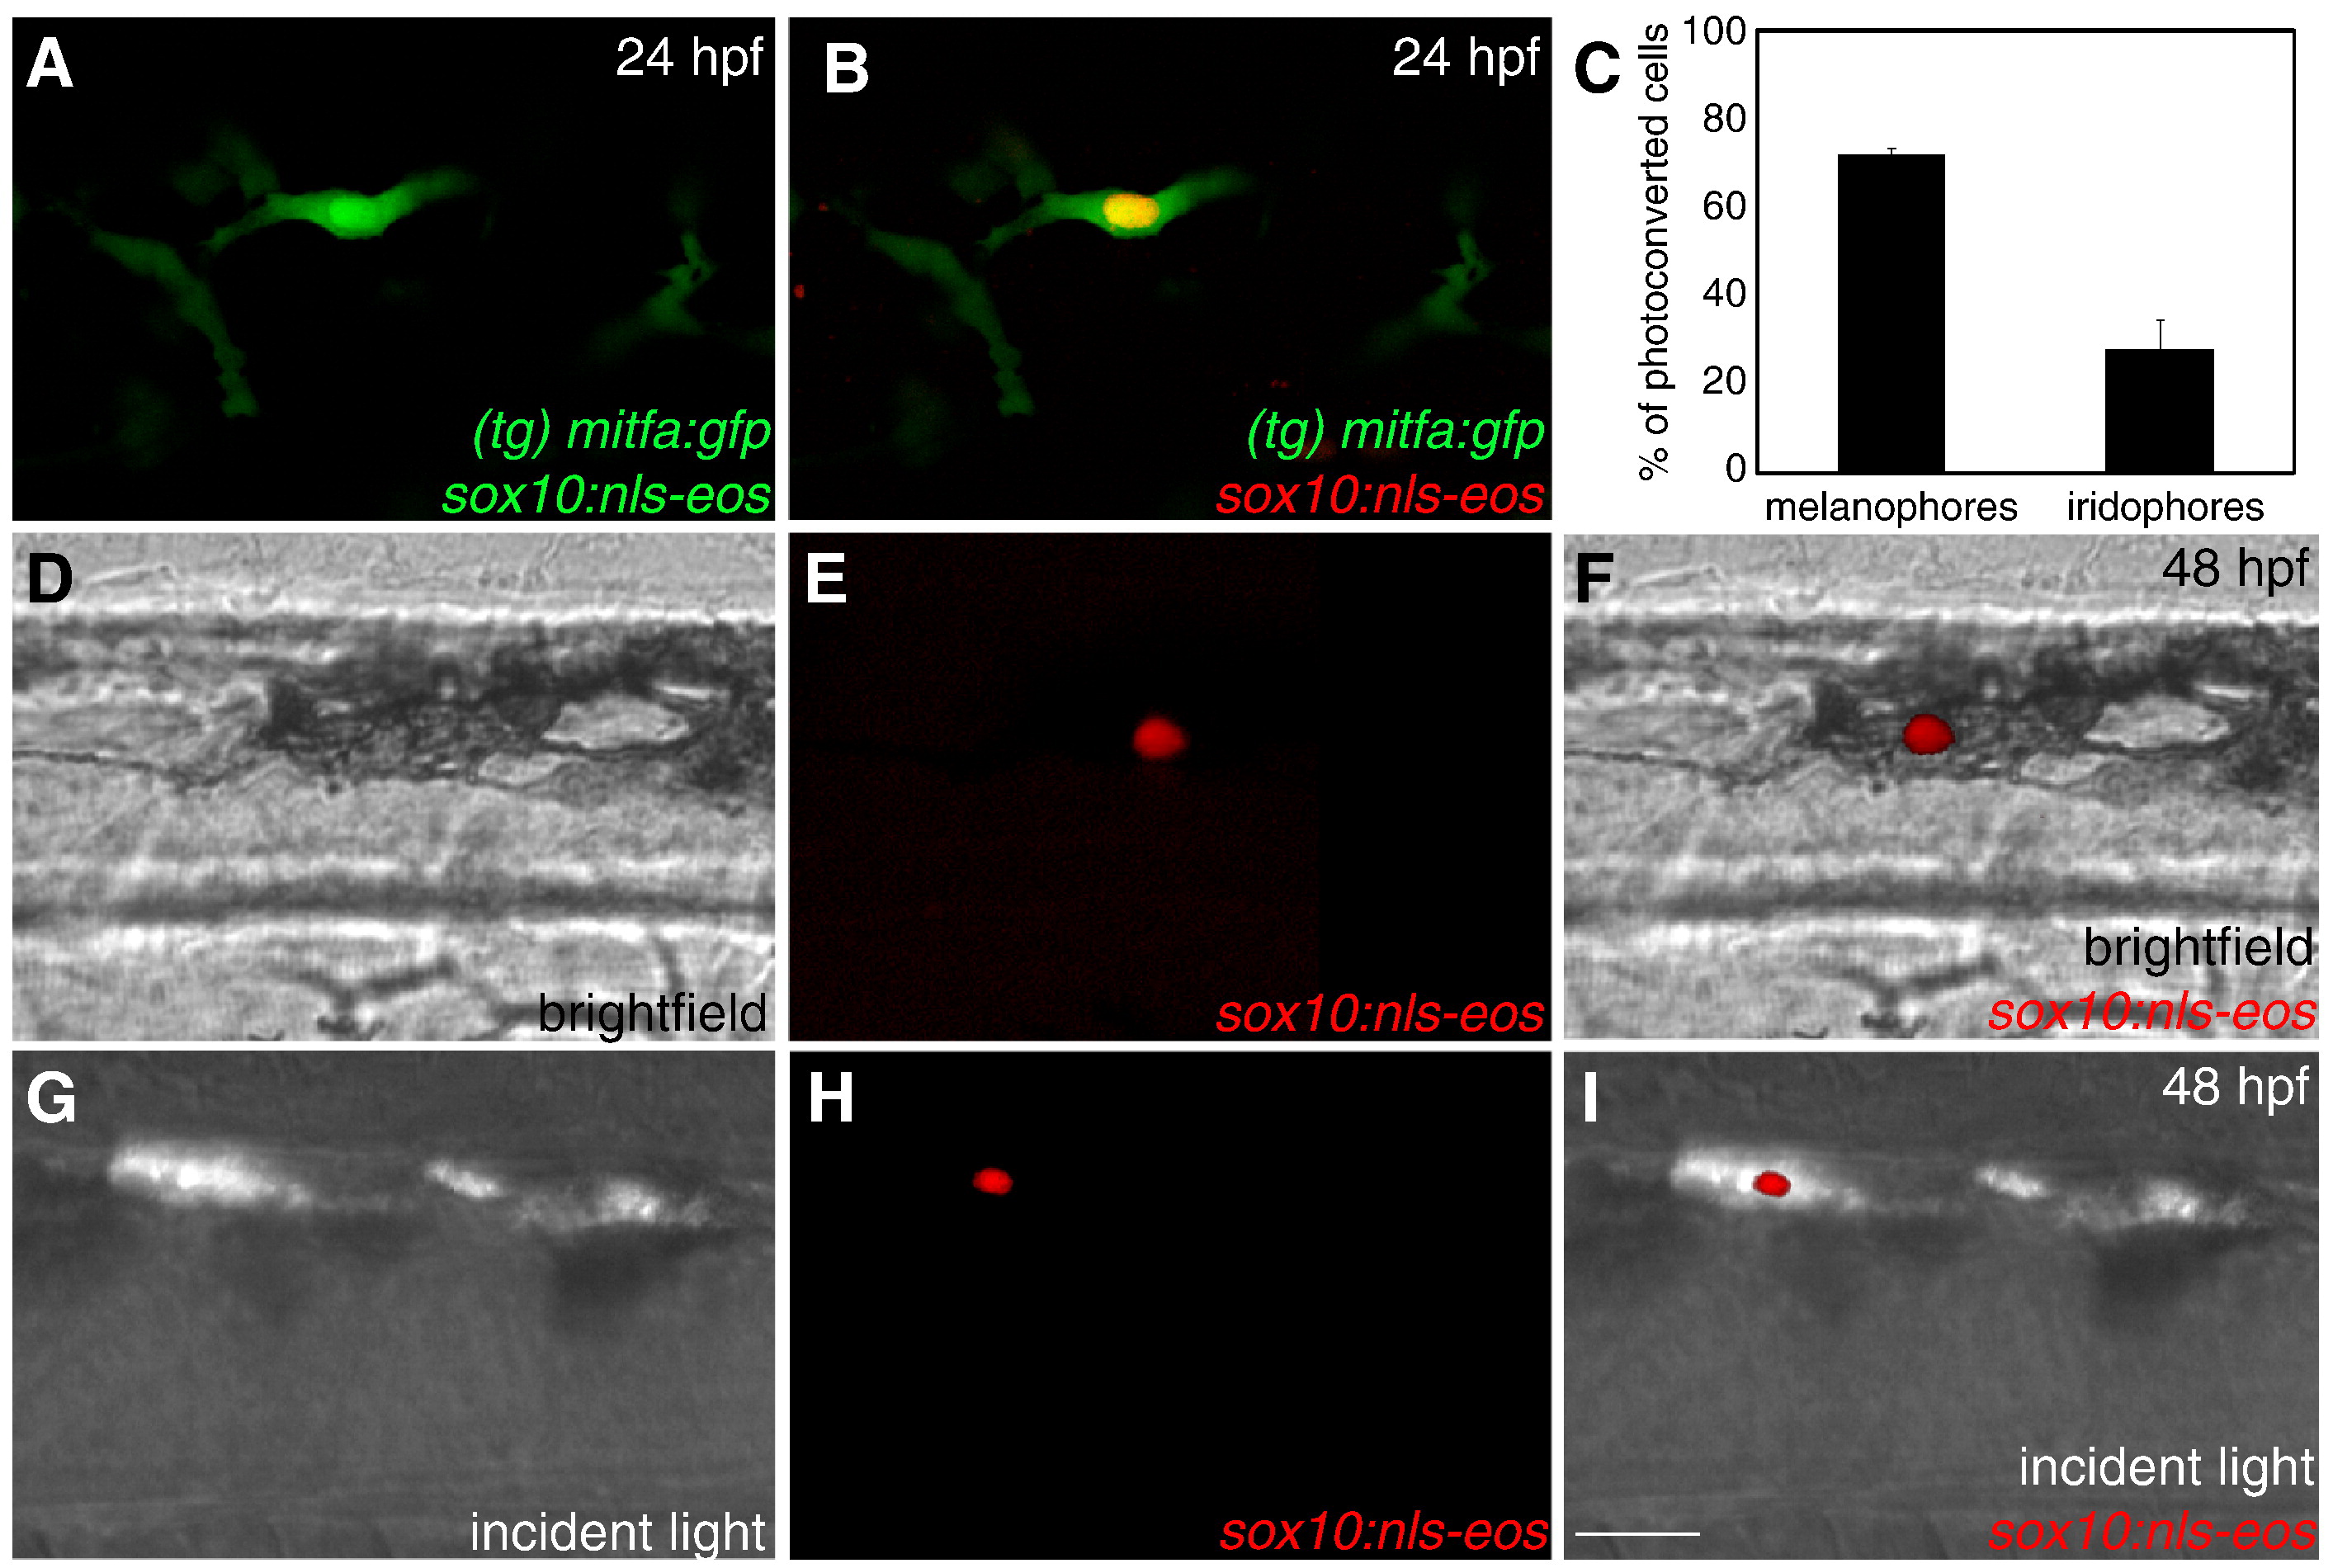
Fig. 7 Melanoblasts and iridoblasts share a mitfa+ bi-potent precursor. (A,B) Confocal image of a double-positive sox10:nls-eos/mitfa:gfp cell surrounded by mitfa:gfp cells, lateral view, anterior trunk, 24 hpf, 40x. (A) Unconverted, pre-UV exposure. (B) Photoconverted, post-UV exposure. (C) Bar graph: 72% of identified photoconverted cells acquire a melanophore fate; 28% of identified photoconverted cells acquire an iridophore fate (n = 144) Bars = s.d. (for all values see Table 4). (D–F) Photoconverted sox10:nls-eos/mitfa:gfp cell acquires melanophore fate, lateral view, anterior trunk, 48 hpf, 40x. (D) Brightfield. (E) Red channel. (F) Merged brightfield/red channel. (G–I) Photoconverted sox10:nls-eos/mitfa:gfp cell acquires iridophore fate, lateral view, anterior trunk, 48 hpf, 40x. (G) Incident light. (H) Red channel. (I) Merged incident/red channel. Scale bars: (A,B, D–I) 30 μm.
Reprinted from Developmental Biology, 344(1), Curran, K., Lister, J.A., Kunkel, G.R., Prendergast, A., Parichy, D.M., and Raible, D.W., Interplay between Foxd3 and Mitf regulates cell fate plasticity in the zebrafish neural crest, 107-118, Copyright (2010) with permission from Elsevier. Full text @ Dev. Biol.