
|
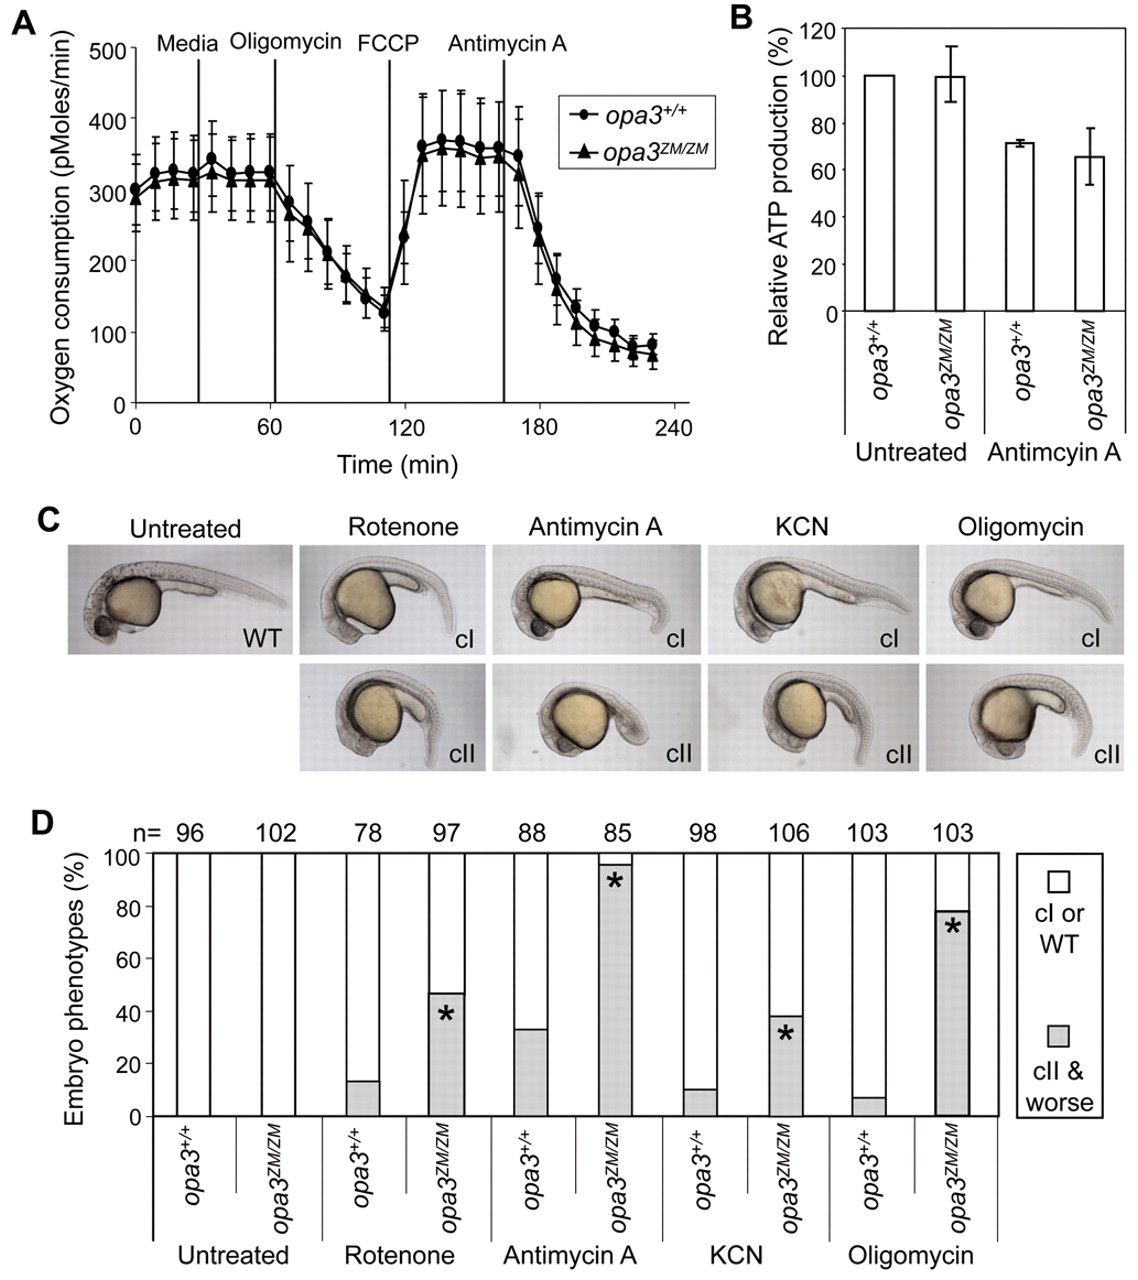
Fig. 8 Loss of Opa3 does not affect overall energy metabolism, yet sensitizes embryos to inhibitors of the electron transport chain. (A) Equivalent mitochondrial respiration in opa3+/+ and opa3ZM/ZM embryos. Mitochondrial activity was inferred from the rate of oxygen depletion, as periodically measured in the micro-environment adjacent to groups of four 14-somite stage embryos, before and after the addition of compounds selected to maximize (FCCP) or minimize (oligomycin, antimycin A) the rate of oxidative phosphorylation. Short vertical lines indicate standard deviations and tall vertical lines show the times of each drug injection. (B) Equivalent ATP production in opa3+/+ and opa3ZM/ZM embryos. opa3+/+ embryos and opa3ZM/ZM embryos were either mock treated or treated with 1 ng/ml antimycin A starting at the four-cell stage and harvested on day 1 for ATP measurements. (C) Effects of ETC inhibitors on embryonic development. Embryos were treated with four different ETC inhibitors and scored at day 1. Resulting phenotypes are shown and categorized as class I (cI) and class II (cII). (D) Sensitivity of opa3ZM/ZM embryos to ETC inhibitors. A substantially larger fraction of opa3ZM/ZM embryos displayed class II phenotypes after drug treatment. Asterisks (*) indicate the statistical significance of the increases (chi square test, P<0.0001) in comparisons with the controls on the left.