
|
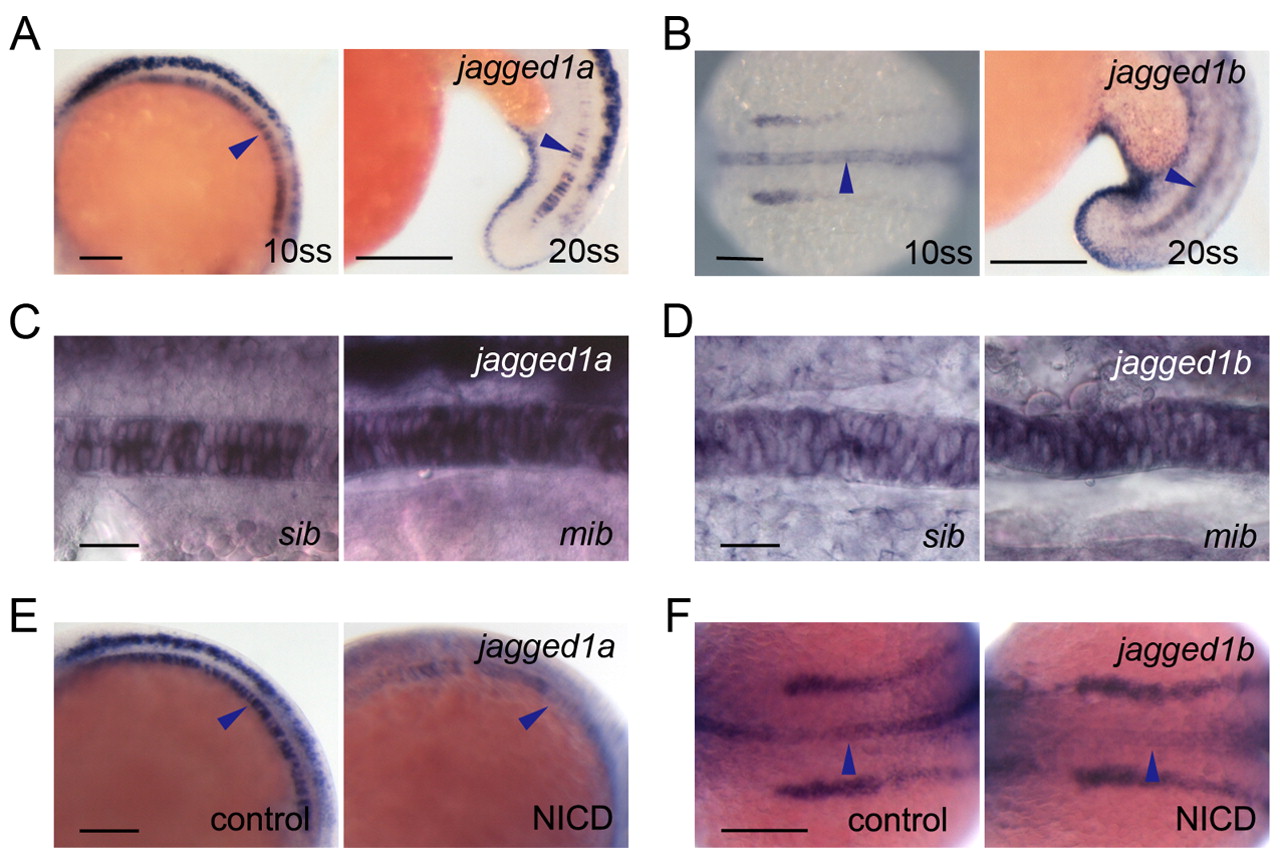
Fig. 2 The two zebrafish jagged 1 homologues are expressed in spatially and temporally restricted patterns in the developing notochord, and their expression is controlled by Notch signalling. (A,B) Expression of jag1a (A) and jag1b (B) in the notochord cells at 10 and 20, ss. (C,D) jag1a (C) and jag1b (D) expression was increased in the mib mutants at 10 ss. sib, sibling control. (E,F) jag1a (E) and jag1b (F) expression was decreased at 10 ss in the notochord of embryos with increased Notch activity. Control siblings (control) or double transgenic Tg(UAS:myc-Notch1a-intra);Tg(hsp70:Gal4) embryos (NICD) were heat shocked at 3 ss. Arrowheads show expression in the notochord. (A-E) Lateral view with anterior to the left, except for 10 ss in B. 10 ss in B and F is a dorsal view with anterior to the left. Scale bars: 100 μm in A,B,E,F; 20 μm in C,D.