
|
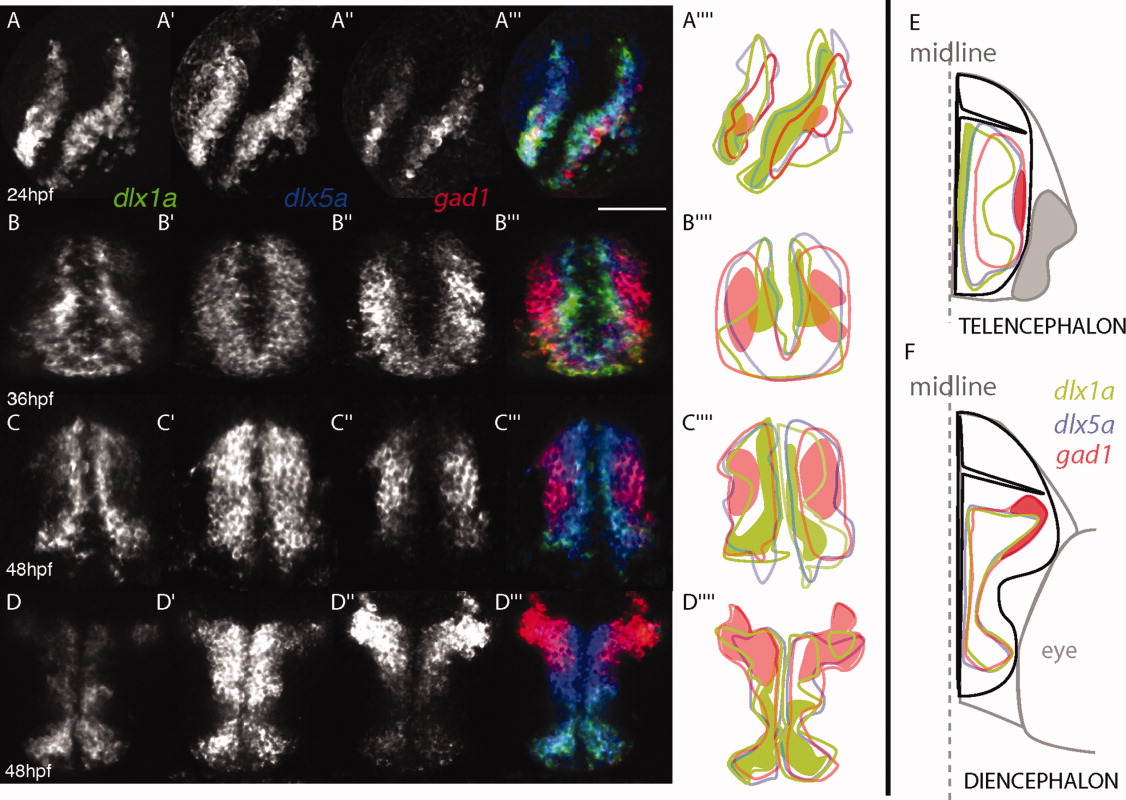
Fig. 2 Expression domains of dlx genes with respect to gad1 expression. A-D″: Single z sections of triple fluorescent in situ hybridization for dlx1a, dlx5a, and gad1 in the telencephalon at 24 hours postfertilization (hpf; A,A″, para-sagittal section, anterior is on the left), 36 hpf (B,B″, transverse section of the telencephalon, dorsal is to the top), and 48 hpf (C,C″, transverse section of the telencephalon; D,D″, transverse section of the diencephalon; dorsal is to the top) with a colored merge of all three channels on A′″, B′″, C′″, and D′″. For each section level, a schematic representation is given to localize the boundaries of each expression domain (solid line) and domains of higher levels of expression is represented as a colored surface. E: A schematic representation of the partially nested expression domains in the telencephalon (left half) and diencephalon (right half) at 48 hpf, based on the data shown in C,C′″ and D,D′″: the proximal (ventricular) domain where only dlx1a is detected is shown in green and the lateral domain where gad1 only is detected is colored red. Scale bar = 100 μm.