
|
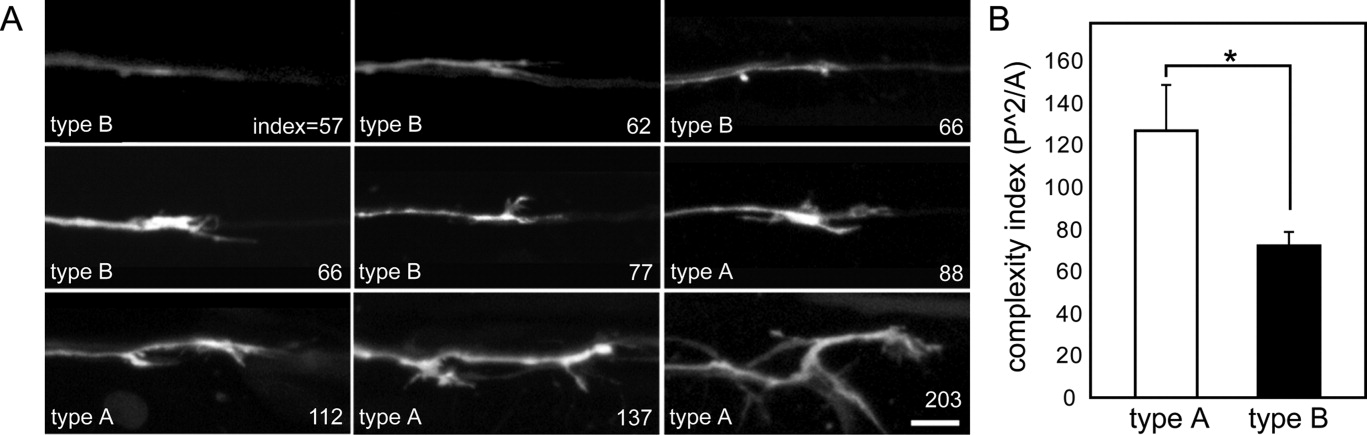
Fig. 3 Morphology of the growth cones of individual posterior lateral line (PLL) neurons. A: Individual growth cones in nine different mosaic embryos. The type of each growth cone (type A or B) is denoted in the lower left corners. The numbers in the lower right corners indicate the complexity index (PΛ2/A; square of the perimeter divided by the area) of each growth cone. All images were taken at the same original magnification. B: Average complexity index ± SEM for the growth cones of type A (n = 15) and type B (n = 23) neurons (*P < 0.005; Student′s t-test corrected for multiple comparisons). Scale bar = 10 μm.