
|
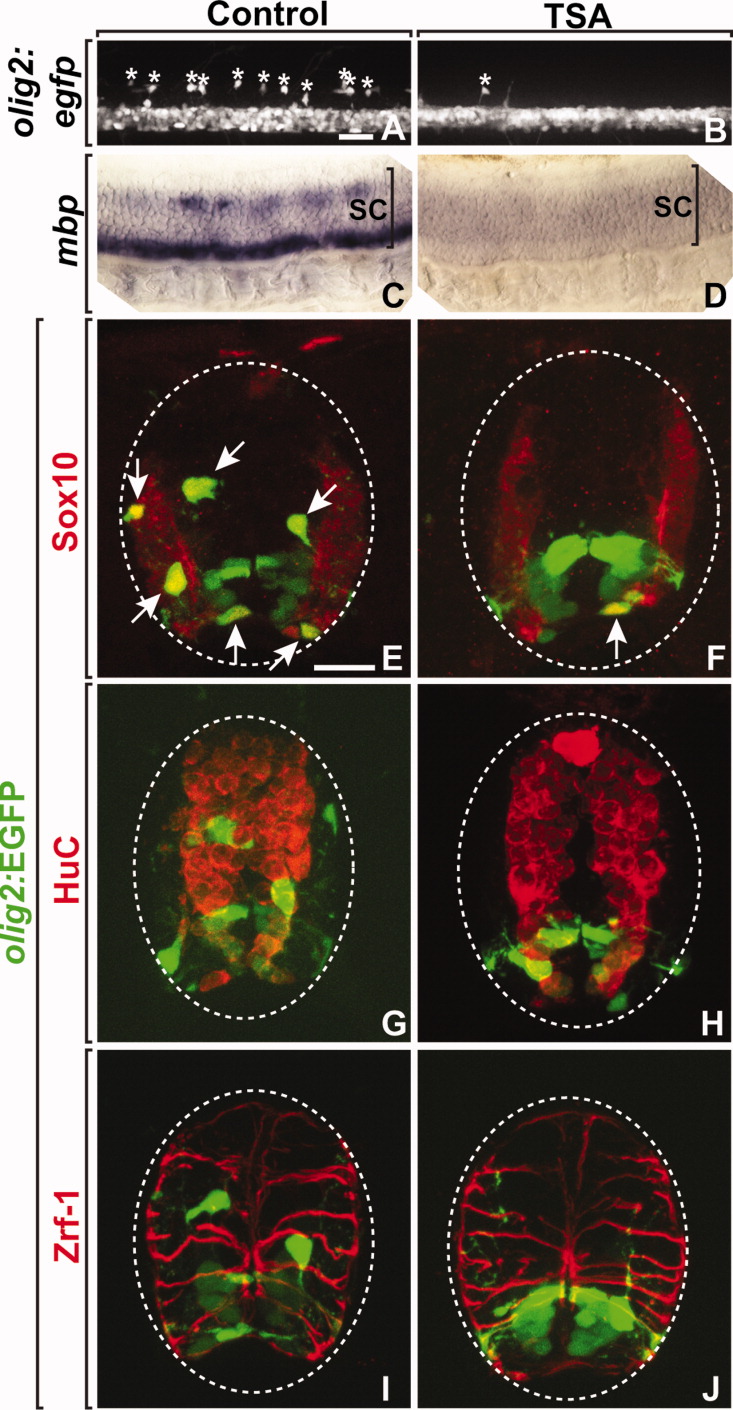
Fig. 1 HDAC inhibitor TSA blocks oligodendrocyte formation. Embryos were treated with TSA from 36 hours postfertilization (hpf) to 3 days postfertilization (dpf). A,C,E,G,I: Controls. B,D,F,H,J: Trichostatin A (TSA) treated. A-D: Lateral views of the spinal cord. E-J: Transverse sections of the spinal cord of Tg(olig2:egfp) larvae. A,B: Images of the spinal cord of living Tg(olig2:egfp) larvae at 3 dpf. Asterisks indicate dorsally migrated oligodendrocyte progenitor cells (OPCs). C,D: Expression of mbp mRNA at 3 dpf. E,F: Sox10 antibody labeling (red). Arrows indicate Sox10+ olig2:EGFP+ OPCs. G,H: HuC antibody labeling (red) showing neurons. I,J: Zrf-1antibody labeling (red) showing radial glia. Scale bars = 60 μm in A,B, 15 μm in E-J. SC, spinal cord; EGFP, enhanced green fluorescent protein.