
|
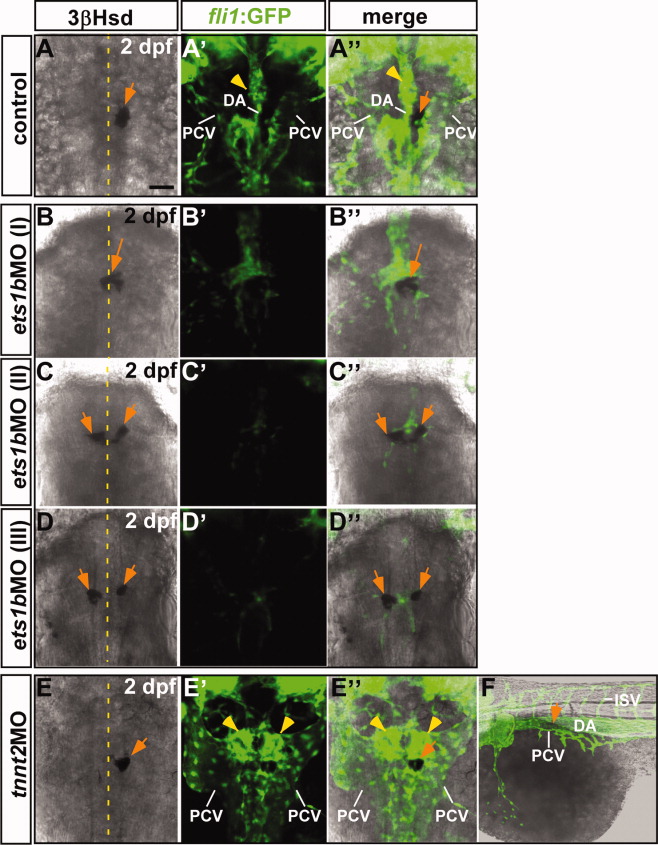
Fig. 2 Effects of the ets1b antisense morpholino injection on the interrenal tissue and its neighboring vasculature. Confocal sections showing the interrenal tissue as detected by 3 β-Hsd activity staining (A-E), and the neighboring endothelium as labeled by green fluorescence (A′-E′), of 2-dpf Tg(fli1:EGFP)Y1 embryos uninjected (A), injected with ets1bMO (B-D), or with tnnt2MO (E), respectively. A″-E″: The merged images of 3 β-Hsd activity staining and GFP. A-E are dorsal views with anterior oriented to the top. F: The merged image of 3 β-Hsd staining and GFP of the same embryo as in E-E″, a lateral view with anterior to the left. B-B″, C-C″, D-D″: Classes I to III of interrenal phenotypes in the ets1b morphant, where the trunk endothelium was reduced and the axial vascular formation inhibited. Vascular ECs, but not the blood flow, are required for the convergence and laterality of the interrenal tissue. Yellow dotted lines indicate the position of the midline. Orange arrows, interrenal tissues; yellow arrowheads, angiogenic glomerulus; DA, dorsal aorta; PCV, posterior cardinal vein; ISV, intersegmental vessel. Scale bar = 50 μM.