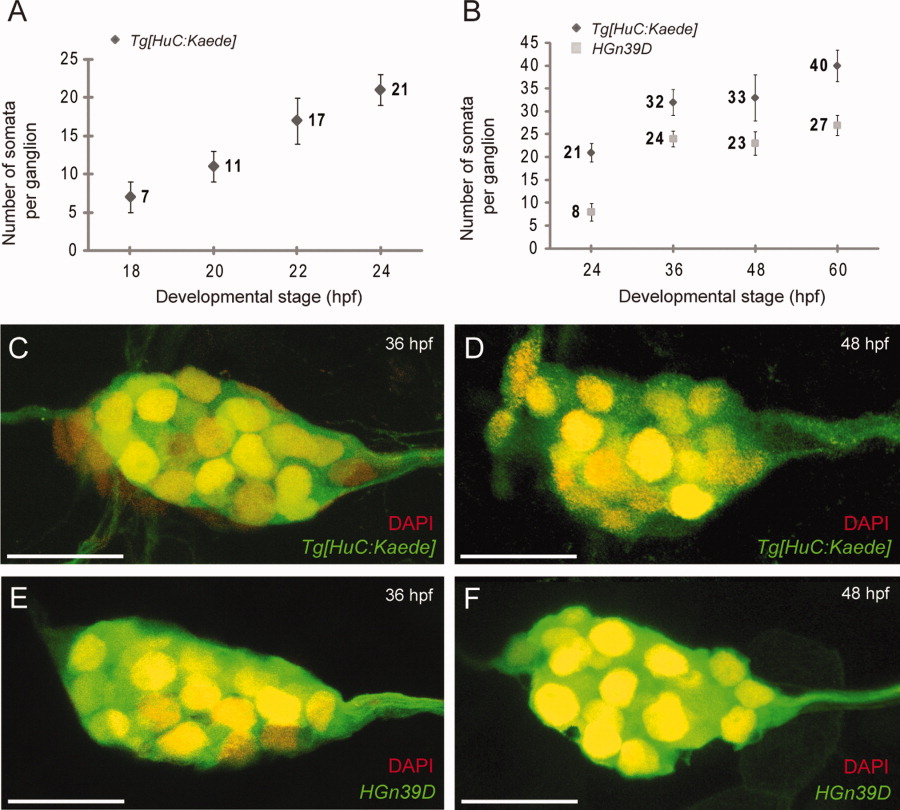
Fig. 1 Progressive neurogenesis in the posterior lateralis ganglion. A: Average number of somata per posterior lateralis ganglion in the Tg[HuC:Kaede] transgenic line from 18 to 24 hpf, with a temporal resolution of 2 h (N=10). B: Comparison of the number of somata per posterior lateralis ganglion in the Tg[HuC:Kaede] and HGn39D transgenic lines, from 24 to 60 hpf, with a temporal resolution of 12 hr (N=4). Both show a progressive addition of neurons to the ganglion. Error bars indicate standard deviation. C-F: Maximal projections of Tg[HuC:Kaede] and HGn39D ganglia at 36 and 48 hpf. Tg[HuC:Kaede]green (C,D) and EGFP (E,F). Co-localization of the green and DAPI staining (red) signals fluoresces yellow. All images are lateral views. Dorsal is up, anterior is left. Scale bars = 20 μm.
Image
Figure Caption
Figure Data
Acknowledgments
This image is the copyrighted work of the attributed author or publisher, and
ZFIN has permission only to display this image to its users.
Additional permissions should be obtained from the applicable author or publisher of the image.
Full text @ Dev. Dyn.

