
|
Fig. 4
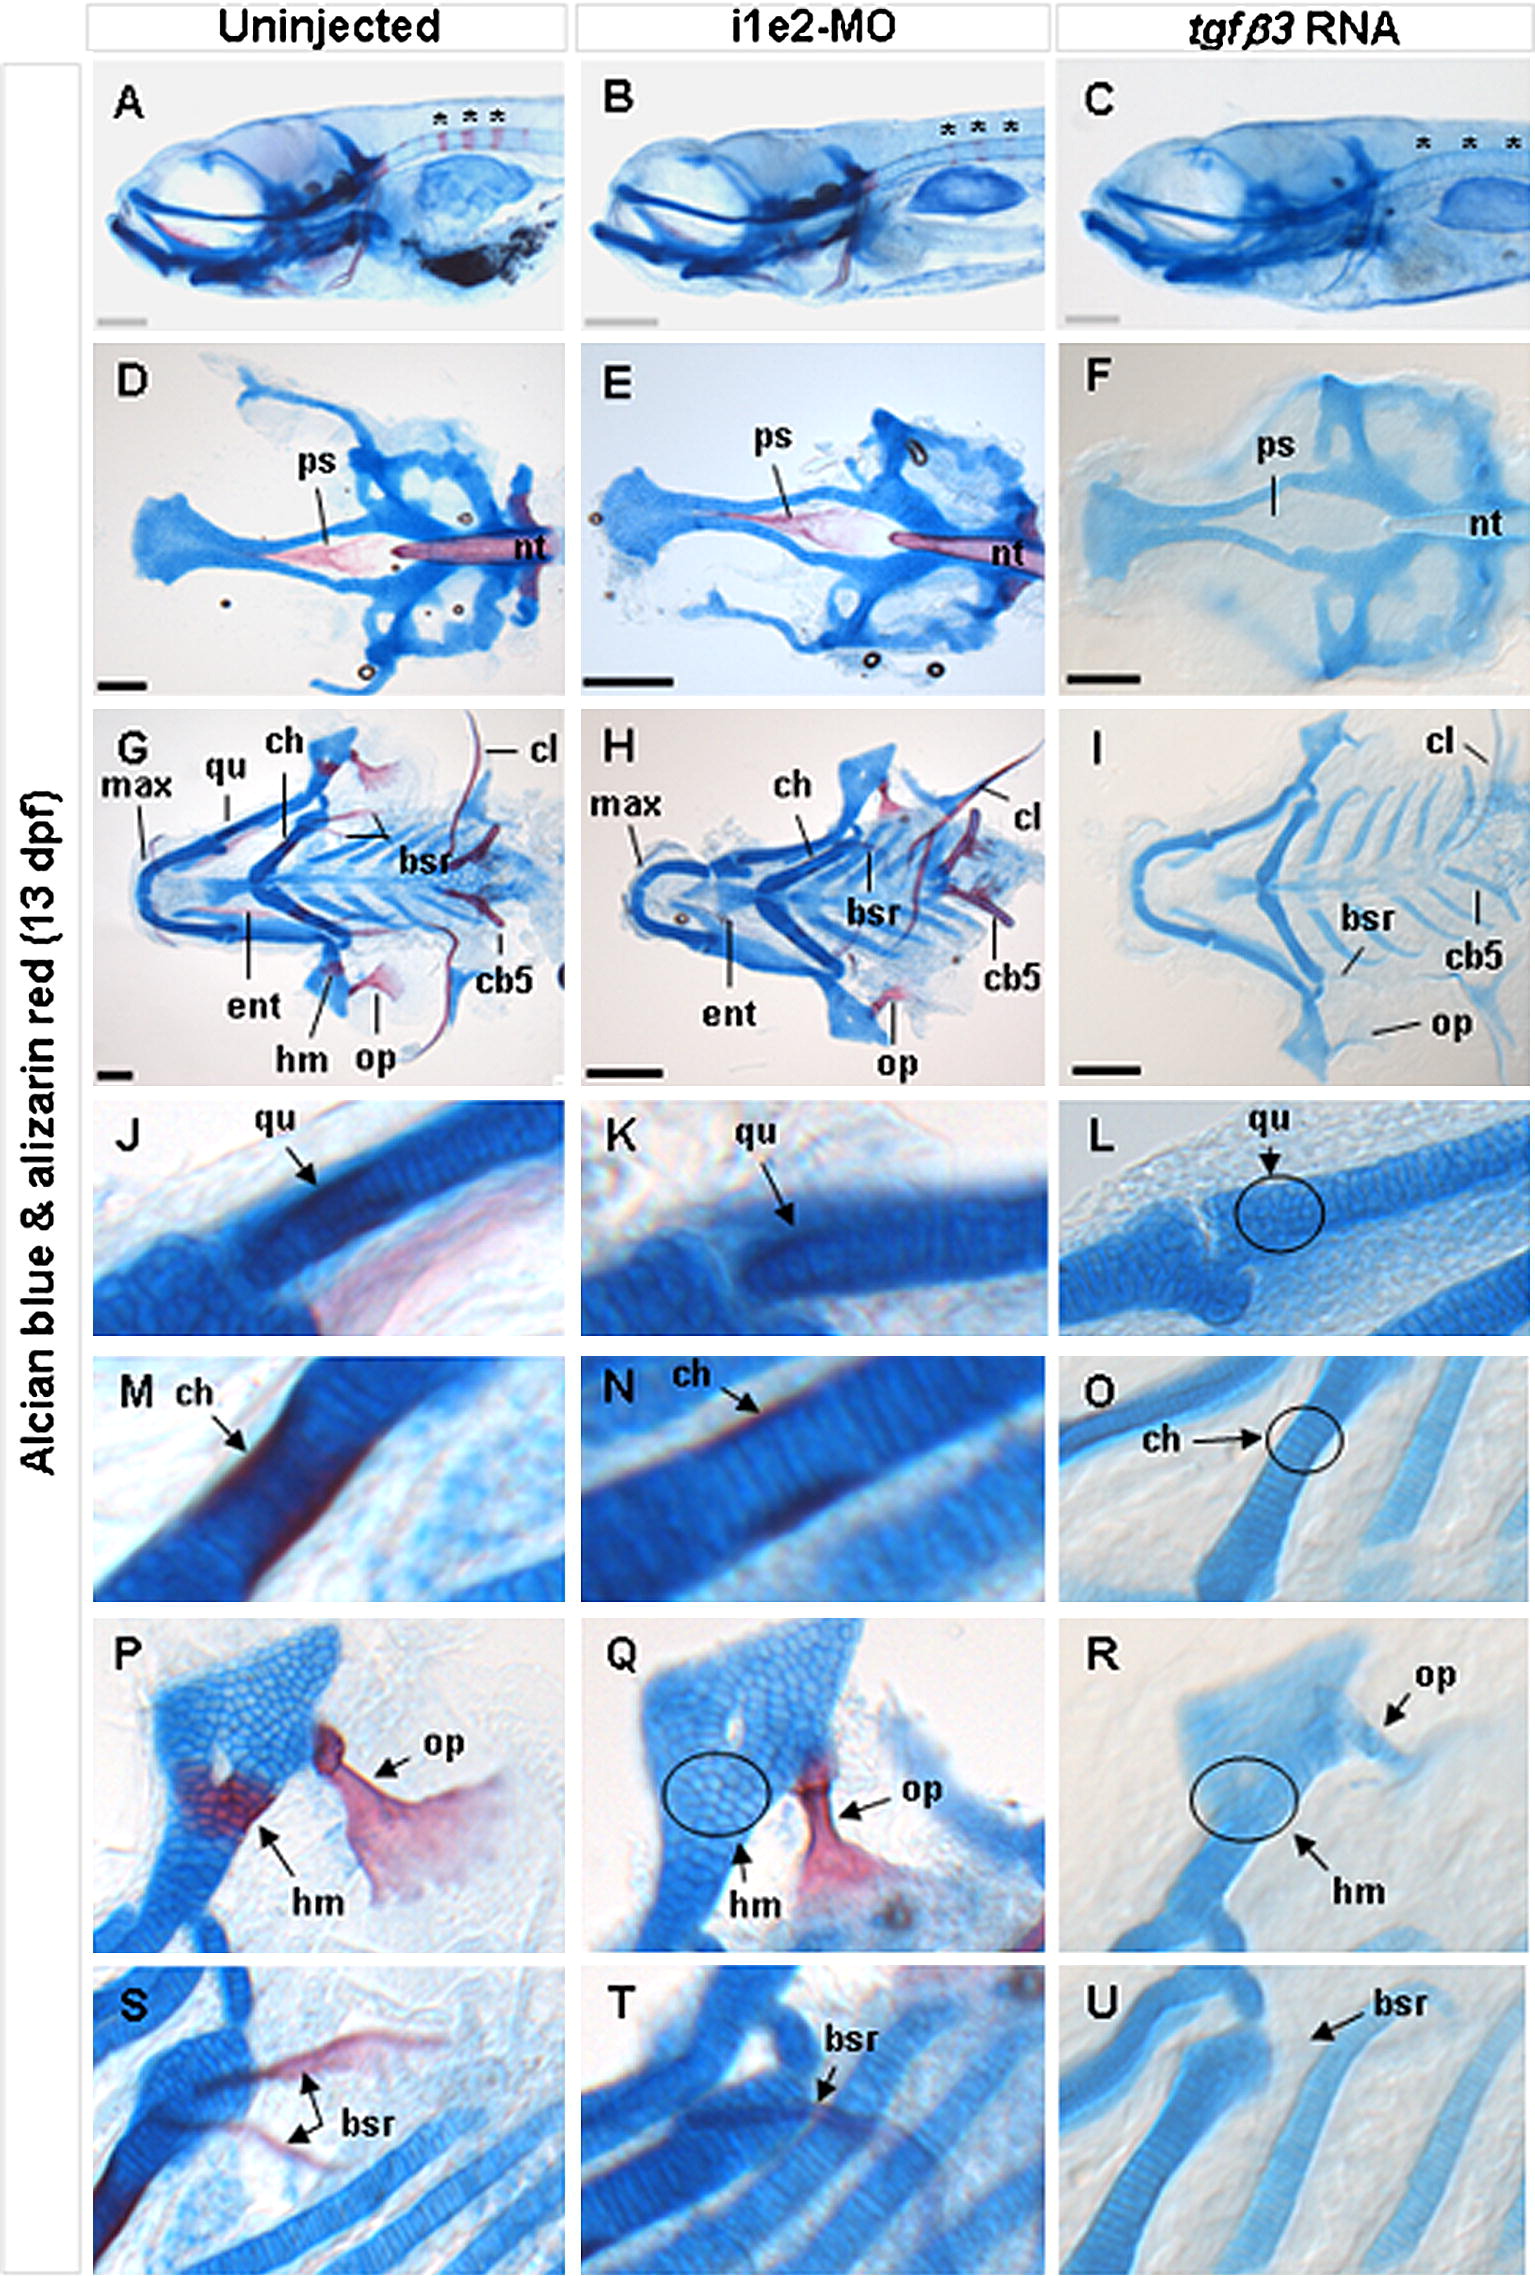
Effect of tgfβ3 knockdown and over-expression on craniofacial bone formation in 13 dpf hatchlings (A–U). Whole-mount lateral (A–C), flat-mount dorsal (D–F,) and flat-mount ventral (G–U) views are shown. In the uninjected 13 dpf hatchling (A), several ossified vertebrae (asterisks) are distinctly visible. These vertebrae are considerably less ossified in the knockdown morphant (B), and entirely undetectable in the tgfβ3 over-expressed hatchling (C). The parasphenoid of the neurocranium (ps) and rostral tip of the notochord (nt) are also normally ossified at 13 dpf (D). Alizarin red staining of these structures is marginally weaker in the knockdown morphant (E), and completely absent in the RNA injected hatchling (F). Pockets of ossification in the hyomandibula (hm) that are normally present at 13 dpf hatchling (G, P) are absent in both the knockdown morphant (H, Q) and over-expressed hatchling (I, R). In addition, the maxilla (max), opercle (op), entopterygoid (ent), ceratohyal (ch), branchiostegal rays (bsr), cleithrum (cl) and ceratobranchial arch 5 (cb5) are under-ossified in the knockdown morphant (H), and completely un-ossified in the over-expressed hatchlings (I). Compared with uninjected hatchling (J, M), the quadrate (qu) and ceratohyal (ch) which form the lateral palate and lower jaw, respectively, are under-ossified in the morphant (K, N), and completely un-ossified in the tgfβ3 over-expressing hatchling (circles in L, O). In addition, the hyomandibula (hm) is un-ossified (circle) and opercle (op) lacks the characteristic fan-shape structure in the morphant (Q) compared to uninjected hatchling (P). In the RNA injected hatchling (R), both the hyomandibula (circle) and opercle are completely un-ossified. The number of branchiostegal rays (bsr) is also reduced and under-ossified, and un-ossified in the knockdown morphant (T) and over-expressing hatchling (U), respectively. Grey and black horizontal scale bars represent 200 µm and 150 μm, respectively.
Reprinted from Mechanisms of Development, 128(7-8), Cheah, F.S., Winkler, C., Jabs, E.W., and Chong, S.S., tgfbeta3 Regulation of Chondrogenesis and Osteogenesis in Zebrafish is Mediated Through Formation and Survival of a Subpopulation of the Cranial Neural Crest, 329-344, Copyright (2010) with permission from Elsevier. Full text @ Mech. Dev.