
|
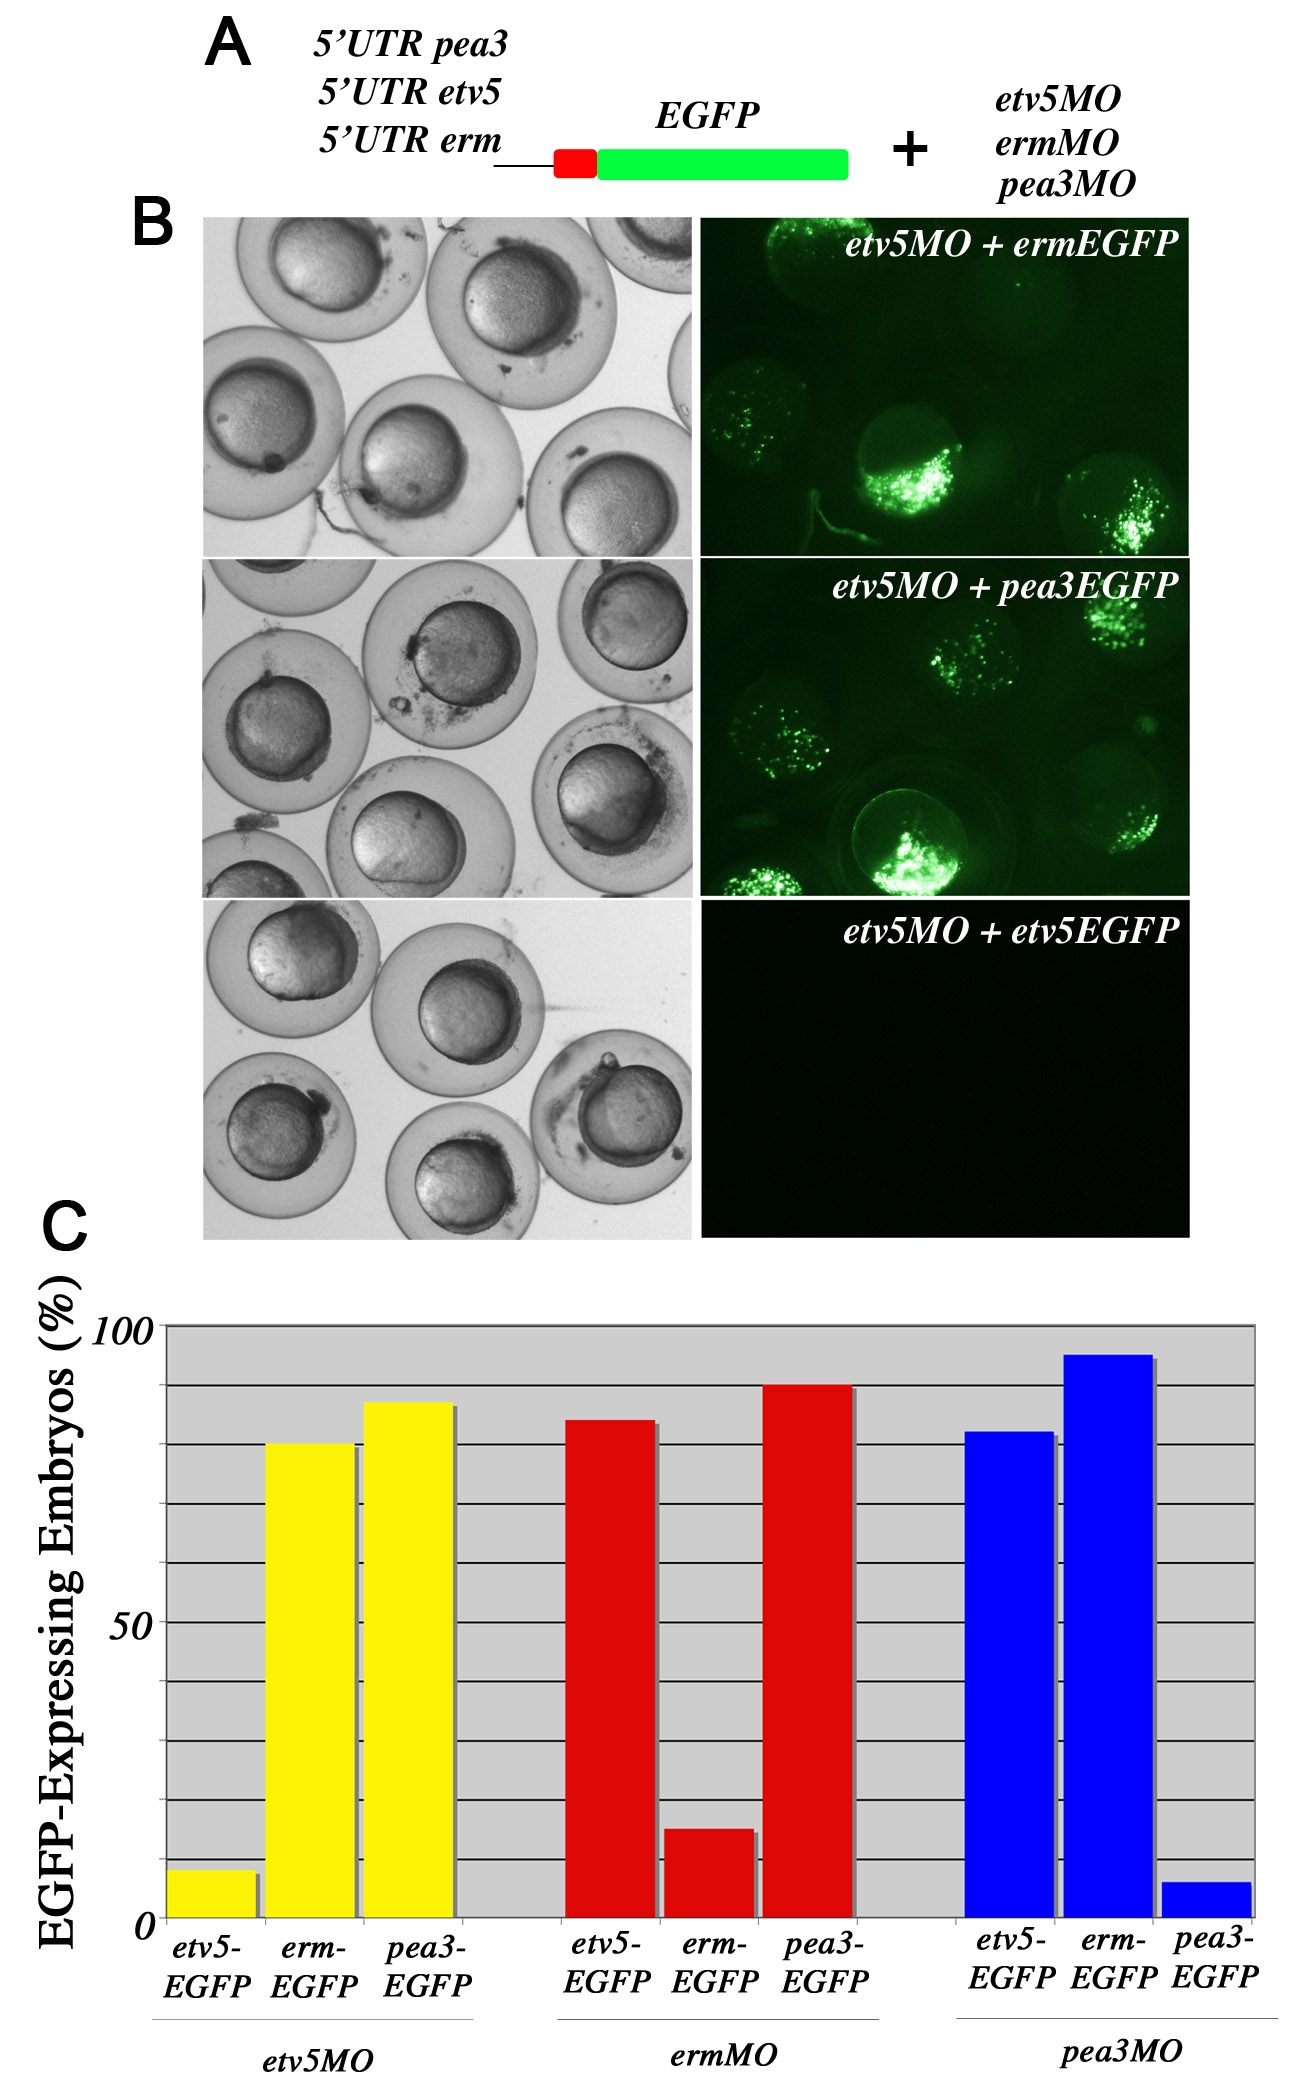
Fig. S3 Specificity of Pea3 ETS MO. (A) Experimental design to determine the specificity of each of the Pea3 ETS MOs. (B) Brightfield live images of shield stage embryos on the left and EGFP expression on the right. The construct and MO injected are indicated in the upper right corner. Embryos co-injected with the 5′UTR erm:EGFP DNA and etv5MO at 2–4 cell stages or with 5′UTR pea3:EGFP DNA and etv5MO at 2–4 cell stages expressed EGFP. In contrast, over 90% of embryos microinjected with 5′UTR etv5:EGFP DNA and etv5MO did not show GFP expression, indicating the efficiency of etv5MO. (C) A graphical representation of all possible combinations of ETS MO and Ets-eGFP, supporting that each MO is specific for the knock-down of only one Pea3 ETS family member.
Reprinted from Developmental Biology, 342(1), Znosko, W.A., Yu, S., Thomas, K., Molina, G.A., Li, C., Tsang, W., Dawid, I.B., Moon, A.M., and Tsang, M., Overlapping functions of Pea3 ETS transcription factors in FGF signaling during zebrafish development, 11-25, Copyright (2010) with permission from Elsevier. Full text @ Dev. Biol.