
|
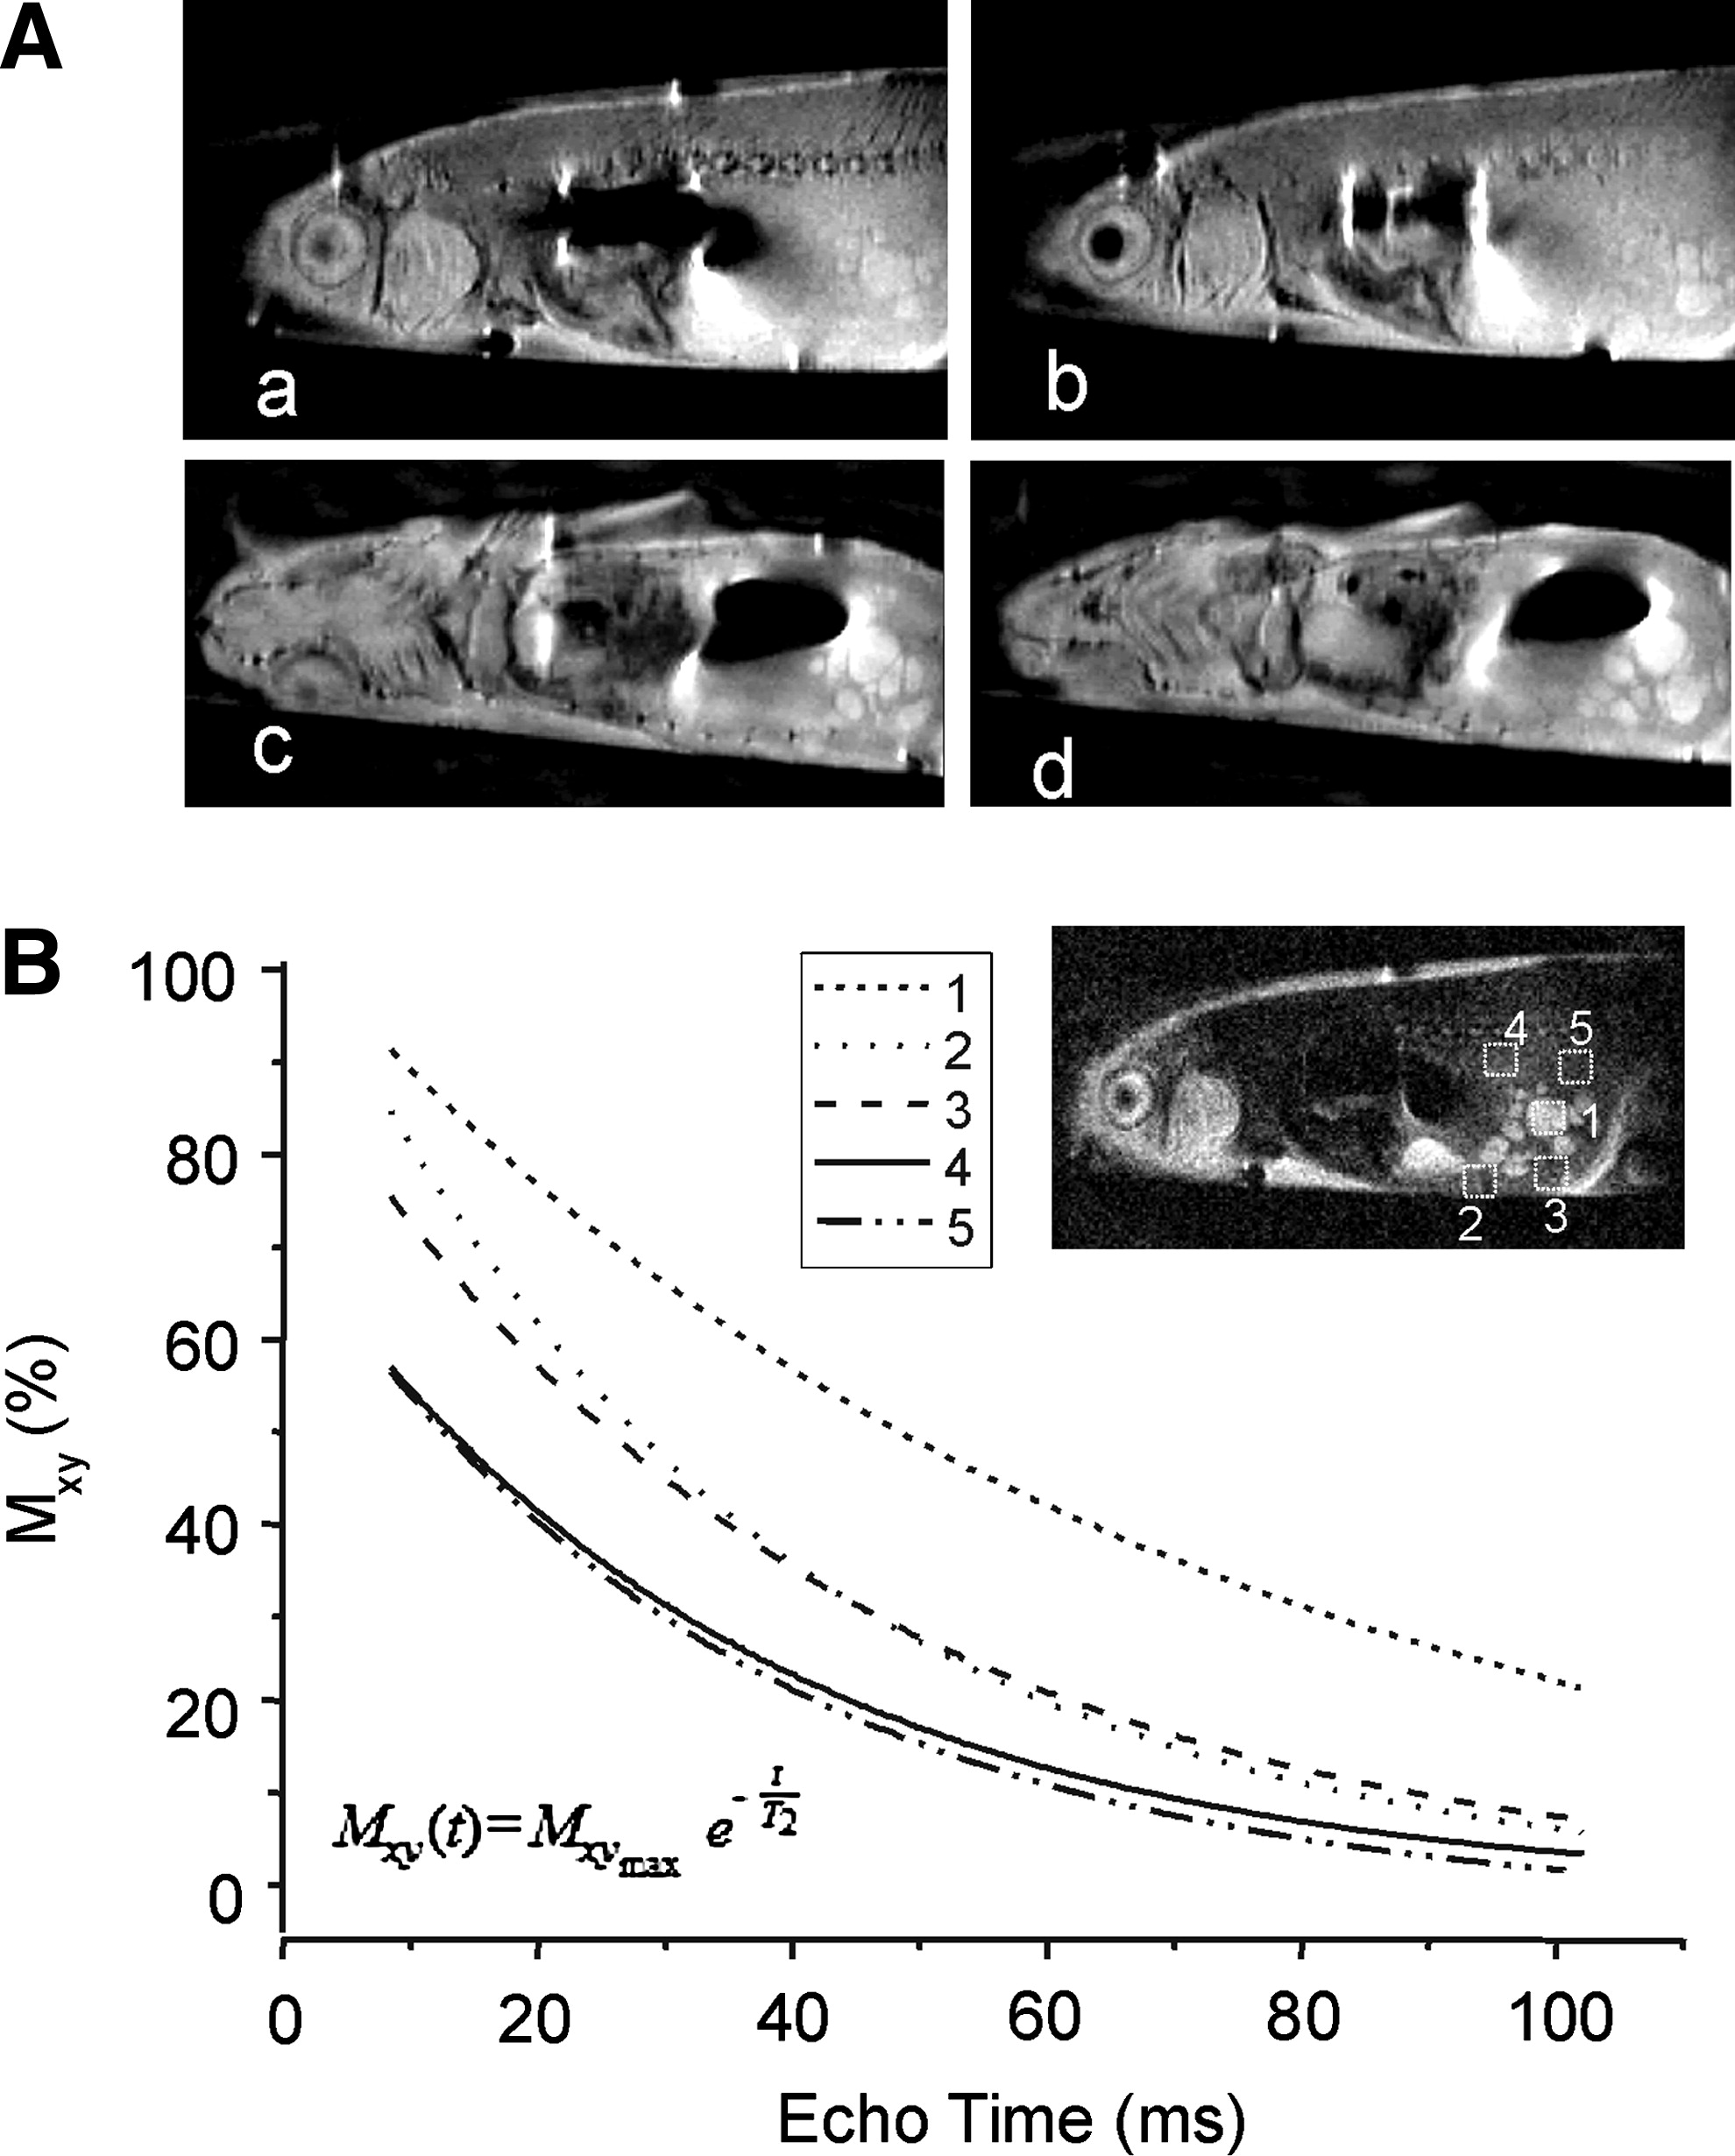
Fig. 4 In vivo characterization of malignant abdominal tumor in transgenic zebrafish using in vivo (MRI at 17.6 T. (A) (MRI slices in coronal (a, b) and sagittal (c, d) planes of living transgenic zebrafish clearly showing the heterogeneity of abdominal tumor. (B) T2 relaxation time measurement of specific regions within (1–3) and outside (4 and 5) tumor as calculated from the plot of TE versus T2 contrast (magnetization present in x–y plane, Mxy) by applying the equation as shown at the bottom of the curve. T2 relaxation times in regions 1, 2, 3, 4, and 5 were 66.3 ± 4, 36.7 ± 2.5, 42.3 ± 1.3, 35.9 ± 1.8, and 33.4 ± 2.6 ms, respectively.