
|
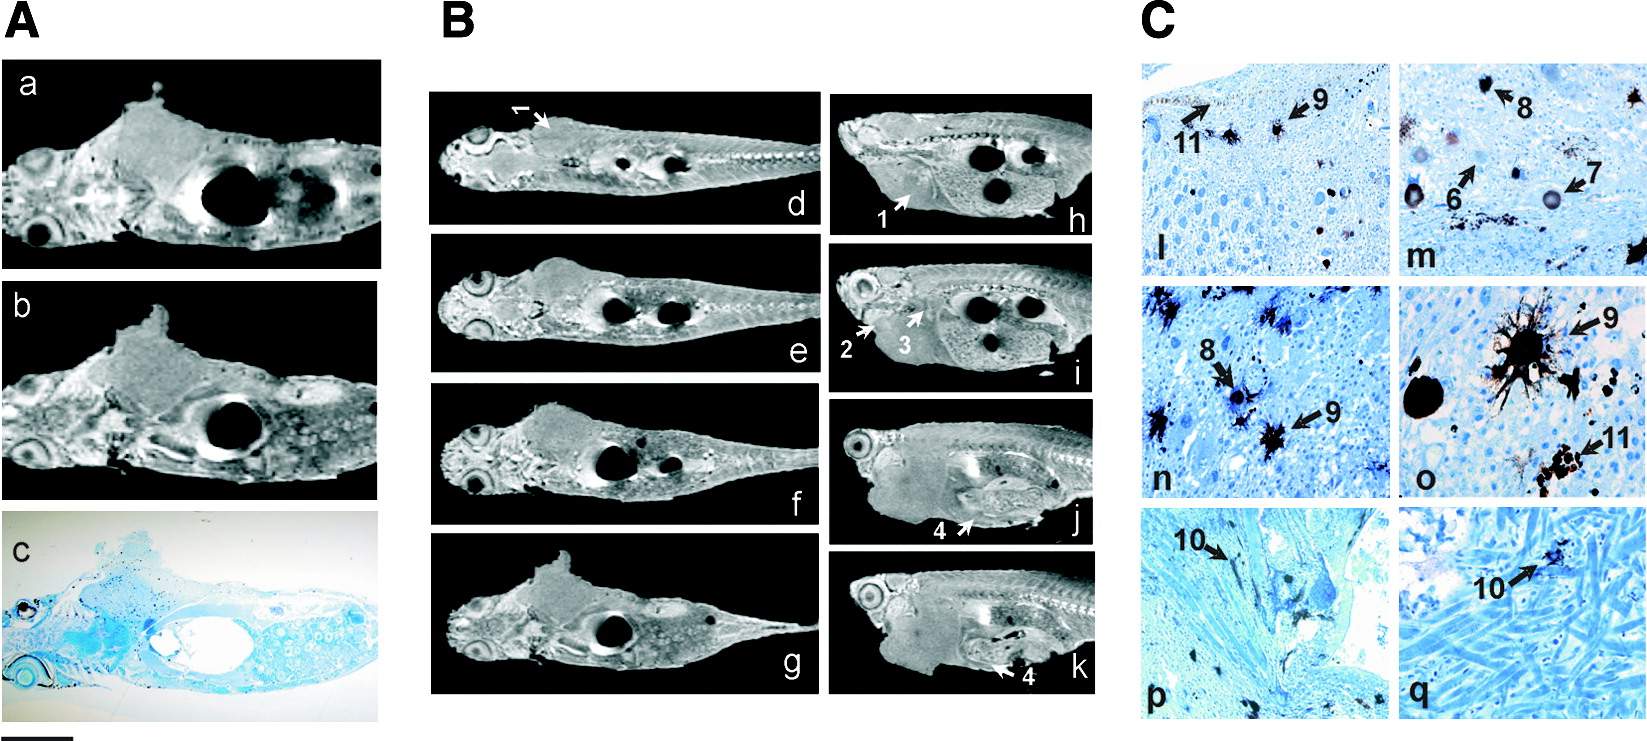
Fig. 2 Characterization of malignant tumor in transgenic mitf:Ras::mitf:GFP X p53-/- zebrafish. (A) Comparison of images of same transgenic zebrafish, with large abdominal tumor, obtained by (a) in vivo μMRI, (b) ex vivo μMRI, and (c) after histological sectioning. (B) Successive (μMRI slices in coronal (d–g) and sagittal (h–k) planes of freshly killed adult transgenic zebrafish showing abdominal tumor (1) location and its penetration in various locations such as heart (2), liver (3), and intestine (4). (C) (l–q) High-magnification view of tumor showing its heterogeneity and cell morphology. Different stages of melanocyte differentiation are clearly visible, for example, precursor cells (6) and immature (7), mature (8), and dendritic (9) melanocytes. The penetration of melanocytes in muscle cells (10) and melanin vesicles produced by melanocytes (11) are clearly visible. Scale bars (10 mm): 2 mm in (a–c), 5 mm in (d–k), 300 μm in (l, m, q), 250 μm in (n, o), 1 mm in (p). Color images available online at www.liebertonline.com/zeb.