
|
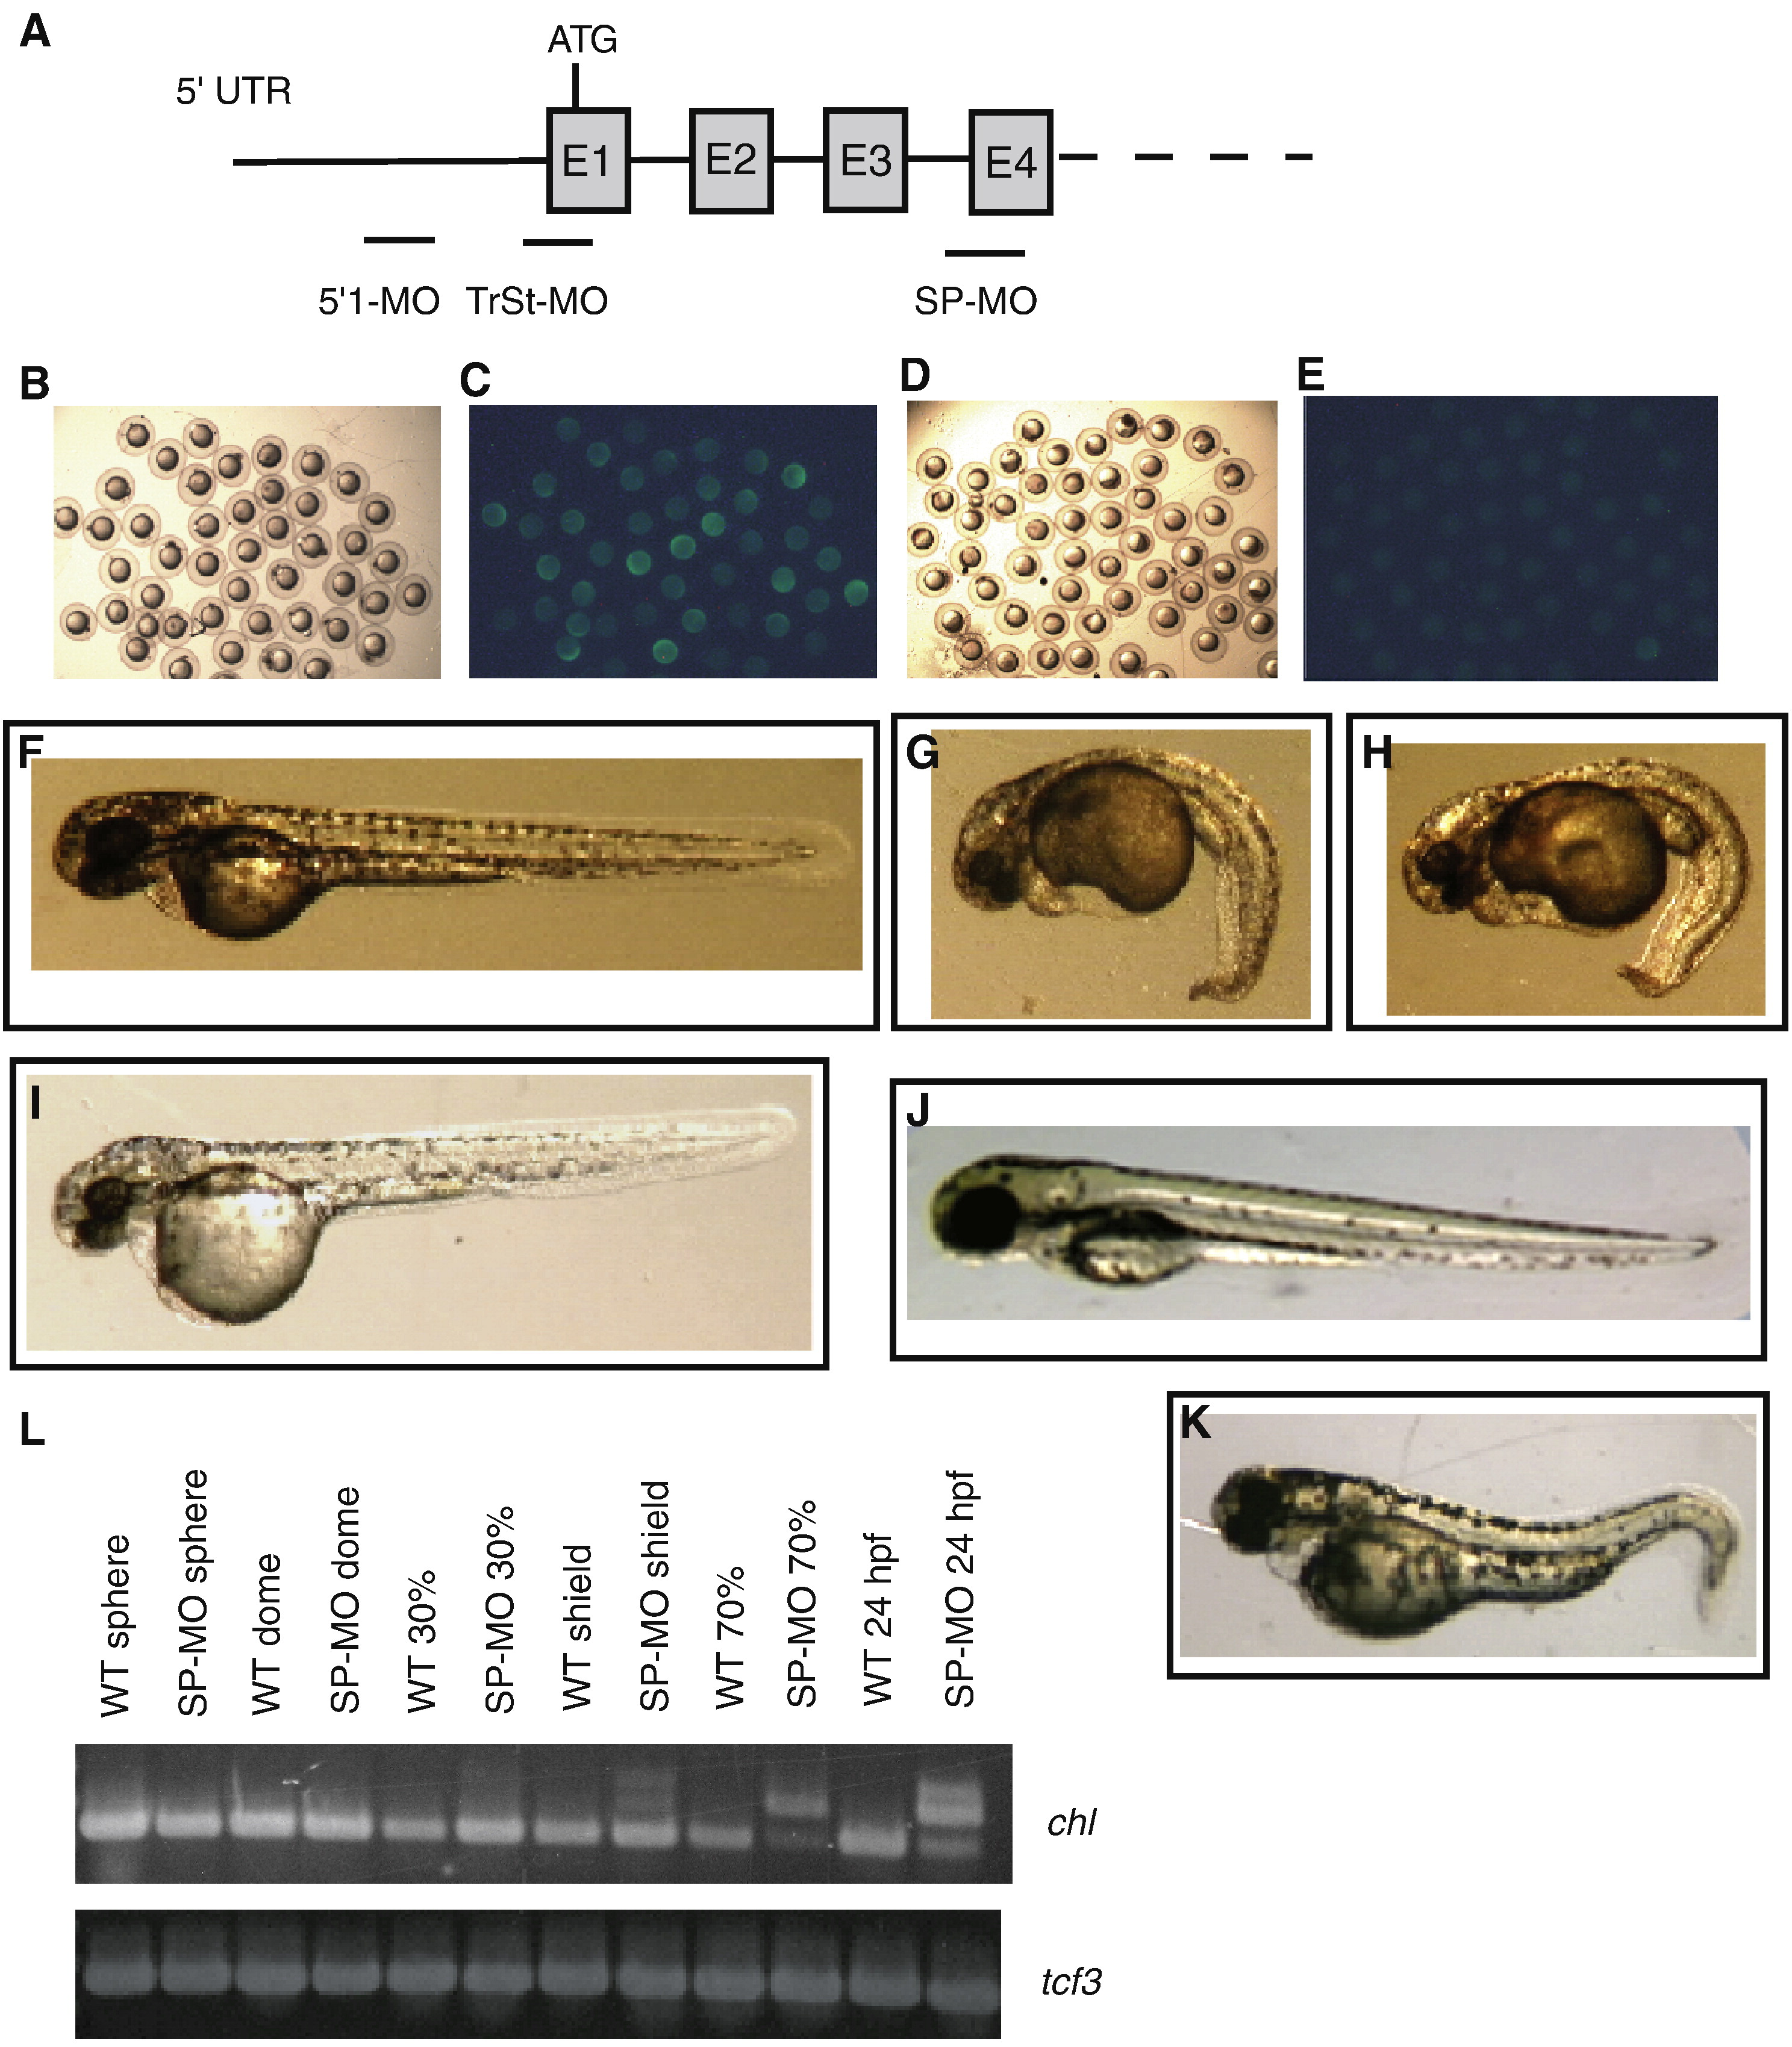
Fig. 6 Treatment with Chl-specific anti-sense MOs. (A) A schematic is shown representing MOs targeting the Chl translation start site (TrSt-MO), or a non-overlapping region of the chl 5′UTR (5′1-MO), or the acceptor splice site of chl exon 4 (E4). Brightfield (B and D) and darkfield (C and E) exposures are shown of 70% epiboly embryos injected at the one-cell stage with 1 ng Chl–GFP RNA and 0.5 mM of either standard control (StCon) MO (B and C) or 5′1-MO (D and E). A comparison at 48 hpf is shown of embryos treated with 0.5 mM standard control (StCon) MO (F), 0.5 mM 5′1-MO (G), 0.5 mM 5′1-MO plus 0.25 mM p53-MO (H), 0.1 mM 5′1-MO (I), or 0.5 mM SP-MO (K). (L) RT-PCR demonstrates the efficacy of SP-MO in inhibiting chl RNA splicing. Inhibition of splicing leading to accumulation of unspliced RNA, represented by one to two lower mobility bands, is clearly seen for shield stage, 70% epiboly, and 24-hpf embryos. Faint bands corresponding to unspliced RNA may also be discerned at 30% epiboly, especially upon comparison of lanes for samples from untreated (WT 30%) and splice site MO-treated (SP-MO 30%) embryos. Expression levels of transcription factor 3 (tcf3) RNA are shown as a loading control.
Reprinted from Developmental Biology, 341(2), Branam, A.M., Hoffman, G.G., Pelegri, F., and Greenspan, D.S., Zebrafish Chordin-like and Chordin Are Functionally Redundant in Regulating Patterning of the Dorsoventral Axis, 444-458, Copyright (2010) with permission from Elsevier. Full text @ Dev. Biol.