
Image
|
Figure Caption
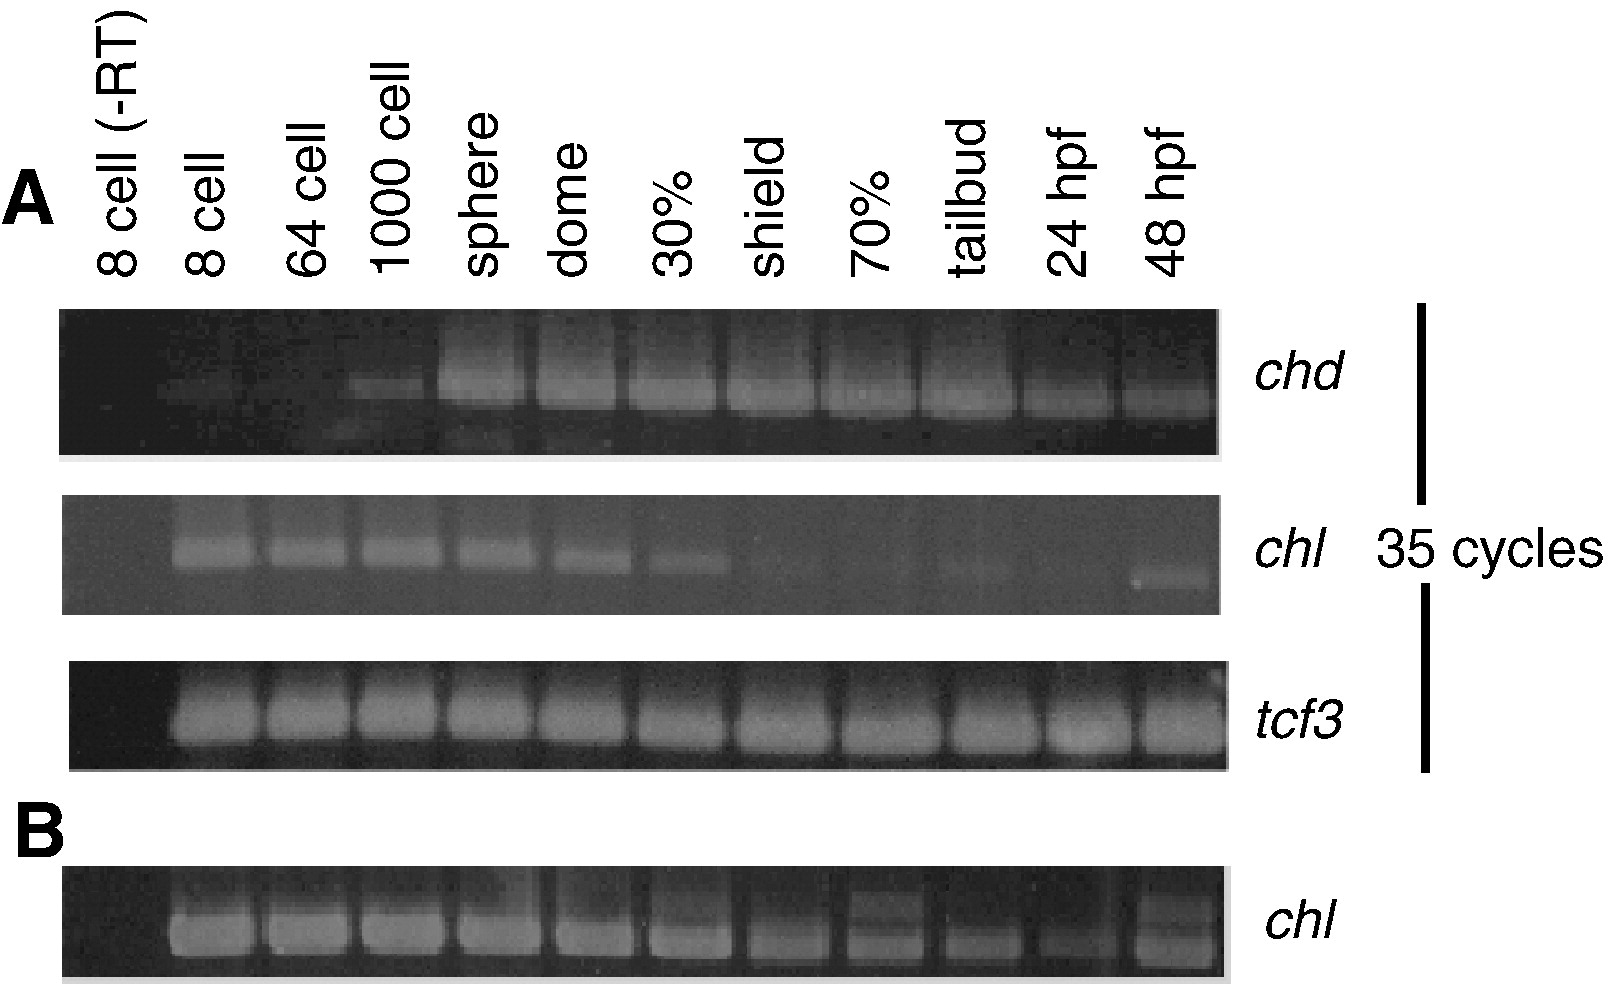
Fig. 2 Comparison of the temporal distributions of Chl and Chd expression during embryogenesis. (A) RT-PCR analysis of Chl and Chd RNA levels was performed for harvested embryos from 8-cell to 48-hpf stages. PCR was for 35 cycles. Expression levels of transcription factor 3 (tcf3) RNA are shown as a loading control. (B) RT-PCR was performed using 40 cycles to demonstrate presence of Chl RNA transcripts from shield stage through 24 hpf.
Figure Data
Acknowledgments
This image is the copyrighted work of the attributed author or publisher, and
ZFIN has permission only to display this image to its users.
Additional permissions should be obtained from the applicable author or publisher of the image.
Reprinted from Developmental Biology, 341(2), Branam, A.M., Hoffman, G.G., Pelegri, F., and Greenspan, D.S., Zebrafish Chordin-like and Chordin Are Functionally Redundant in Regulating Patterning of the Dorsoventral Axis, 444-458, Copyright (2010) with permission from Elsevier. Full text @ Dev. Biol.