
|
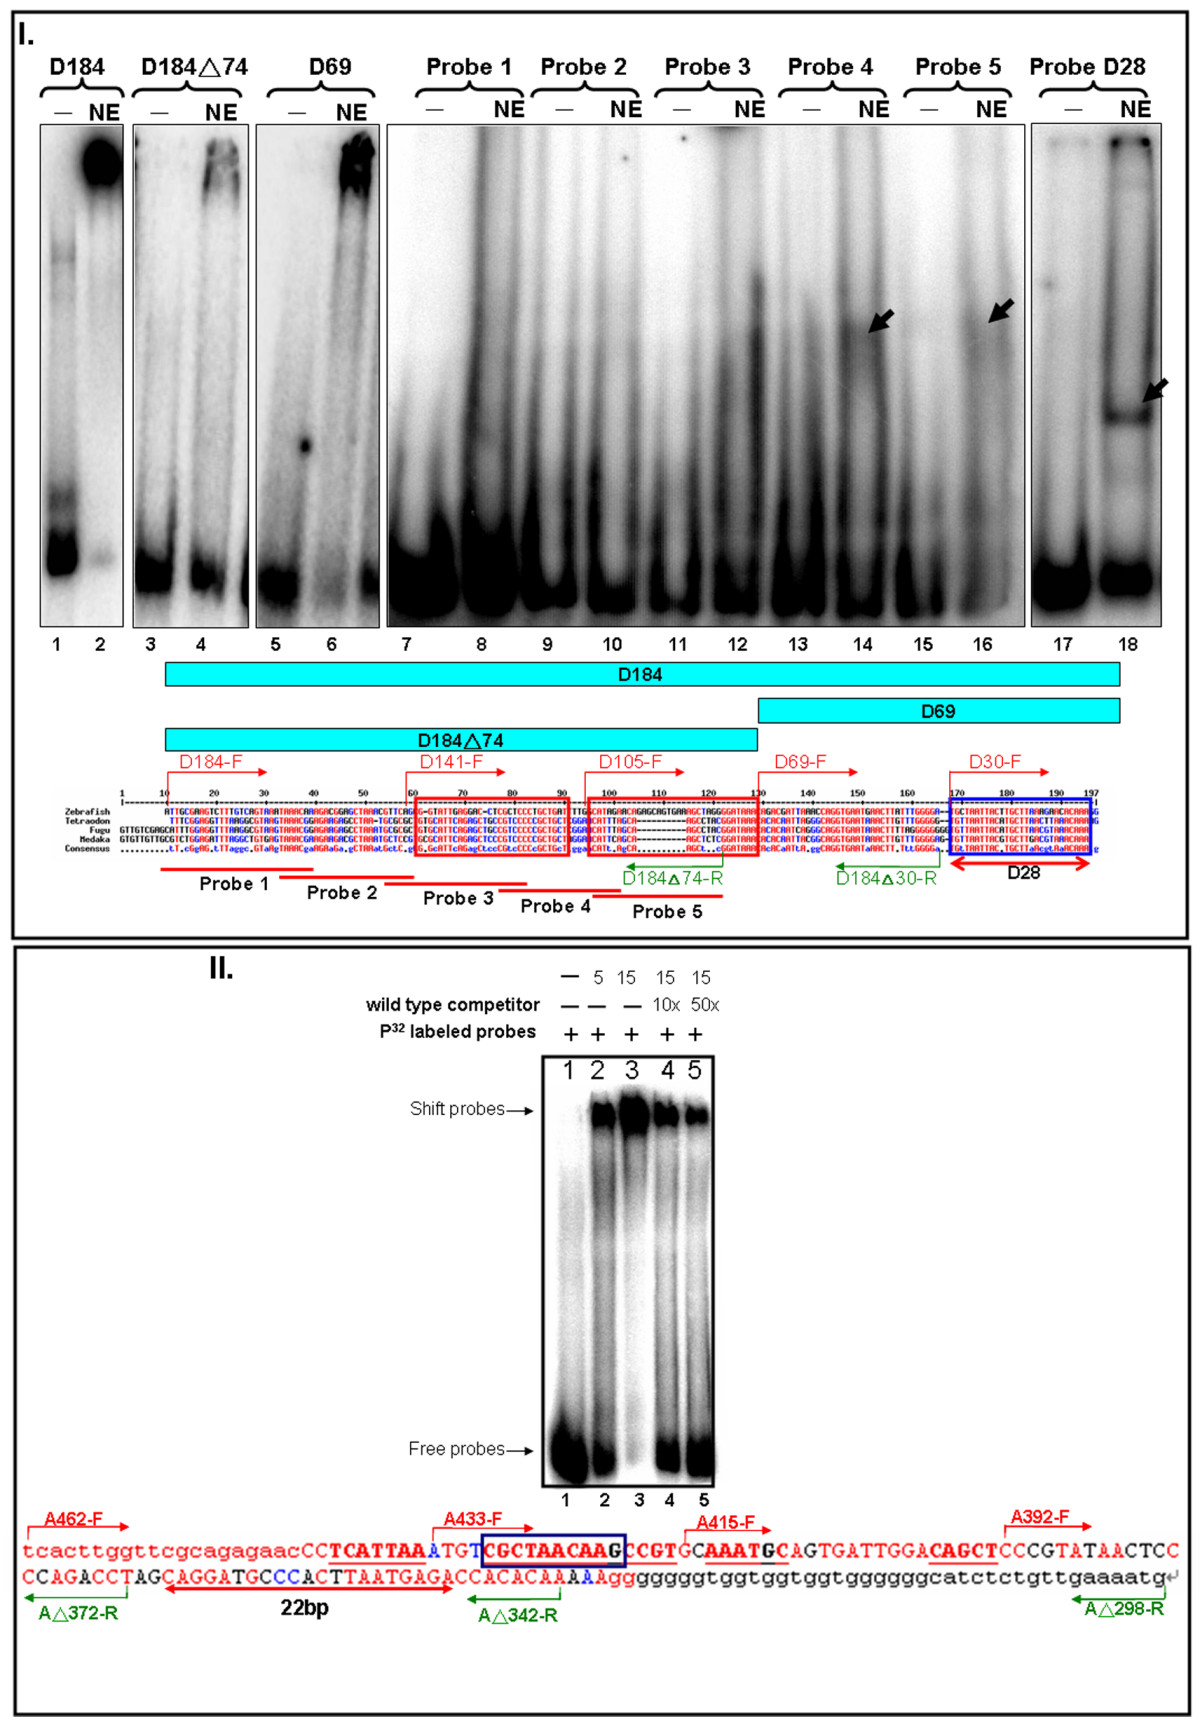
Fig. 7 EMSA analysis of modules D and A. I. EMSA of module D using nine different probes. D184 and two of the smaller probes: D184(triangle)74 covers the 5′ half, and D69 covers the 3′ half were used for EMS. Five different double-stranded oligonucleotides were generated and labeled as probes for EMSA. The 28-bp region (blue box) was generated as double strand oligonucleotide for EMSA. The gel image was obtained with probe only (lane 1, 3, 5, 7, 9, 11, 13, 15 and 17), and with nuclear extract (lane 2, 4, 6, 8, 10, 12, 14, 16 and 18) to detect the binding protein; the sequence is shown below. Conserved sequences in module D were aligned among zebrafish, Tetraodon, fugu and medaka, with the primers used to obtain serial deletion constructs shown in red with direction. The red boxes represent the highly conserved elements. II. EMSA of module A. The gel image was obtained with probe only (lane1), with nuclear extract (lane 2, 3) and with competitor (lane 4, 5) to detect the binding protein using A462(triangle)298; the sequence is shown below. The primers used to obtain serial deletion constructs are shown in green above the sequences, and their length and direction are reflected in the length and direction of the arrows. The 22-bp region (red arrow) was deleted in the A462(triangle)298-Bp-M-GFP construct. The red boxes represent the highly conserved elements.