
|
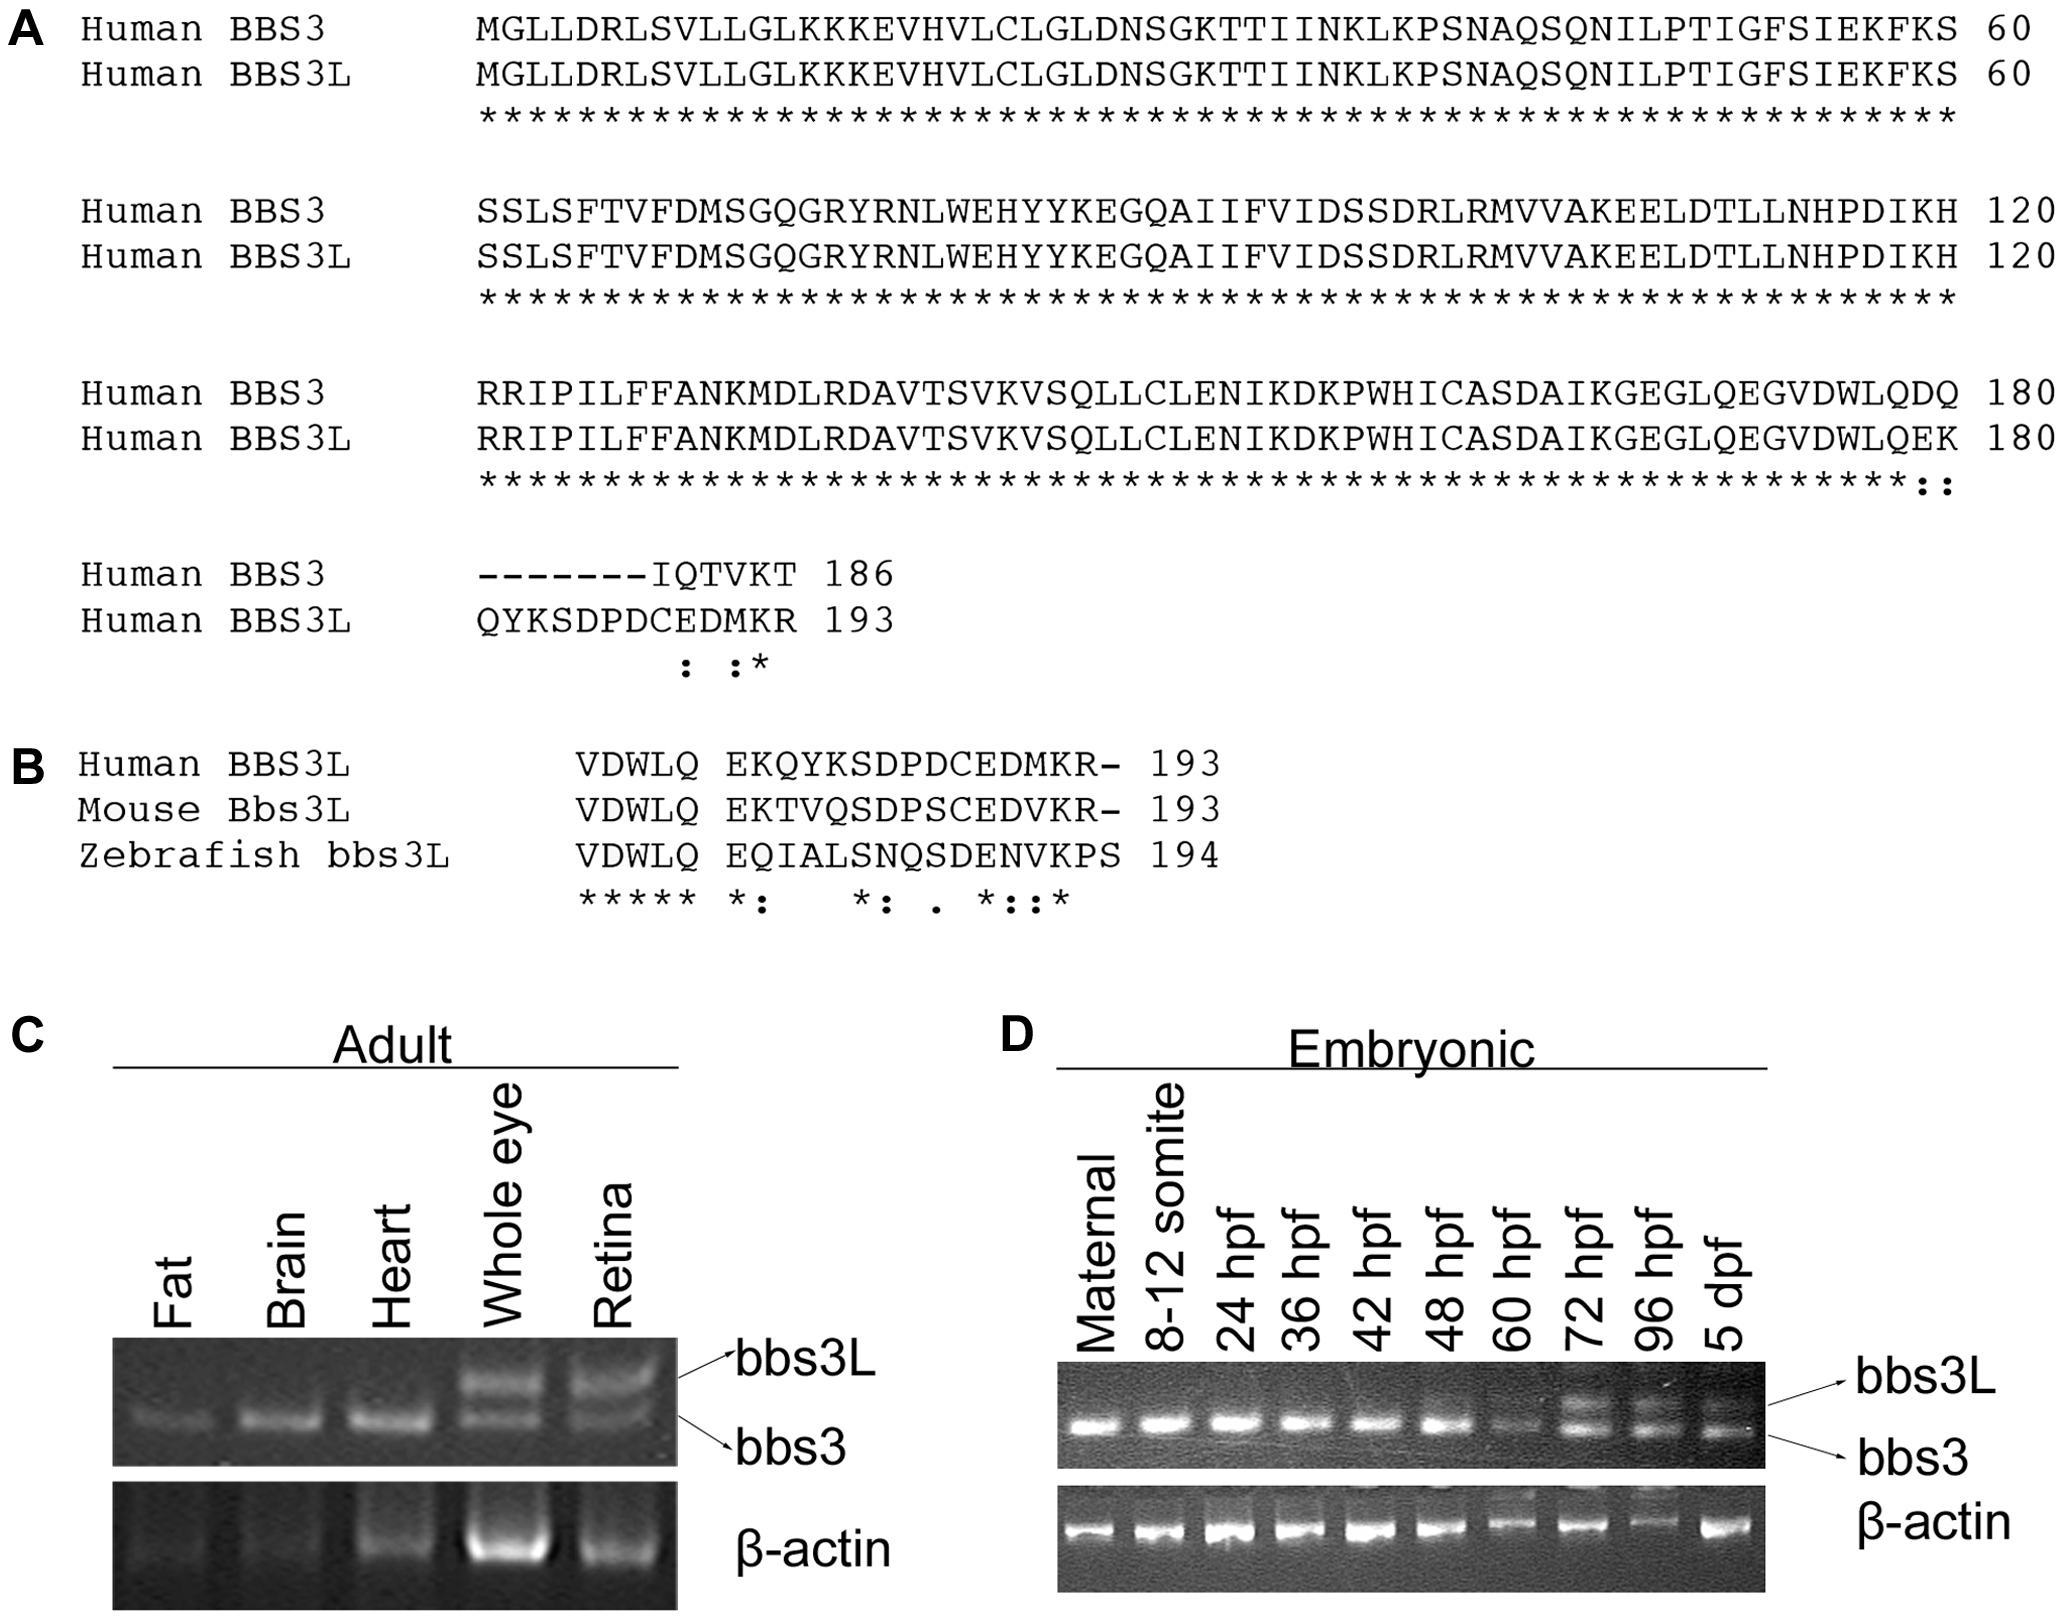
Fig. 1 Identification of a second BBS3 transcript.
(A) Alignment of human BBS3 and BBS3L proteins. (B) C-terminal end alignment of human, mouse, and zebrafish BBS3L protein. Asterisks (*) indicate identical amino acids shared in all alignments, while colons (:) and periods (.) represent conserved amino acids. (C) RT–PCR tissue expression profile of zebrafish bbs3 and bbs3L transcripts in wild-type adult zebrafish tissues: fat, brain, heart, whole eye and retina. β-actin was used as a positive control. bbs3 is expressed in all adult tissues examined, while bbs3L expression is limited to the eye. (D) RT–PCR developmental expression profile of bbs3 and bbs3L at the following stages: maternal, 8–12 somites, 24, 36, 42, 48, 60, 72, 96 hpf, and 5 dpf. bbs3 is expressed throughout development, while the long form is only present by 48 hpf, correlating with photoreceptor development.