
Image
|
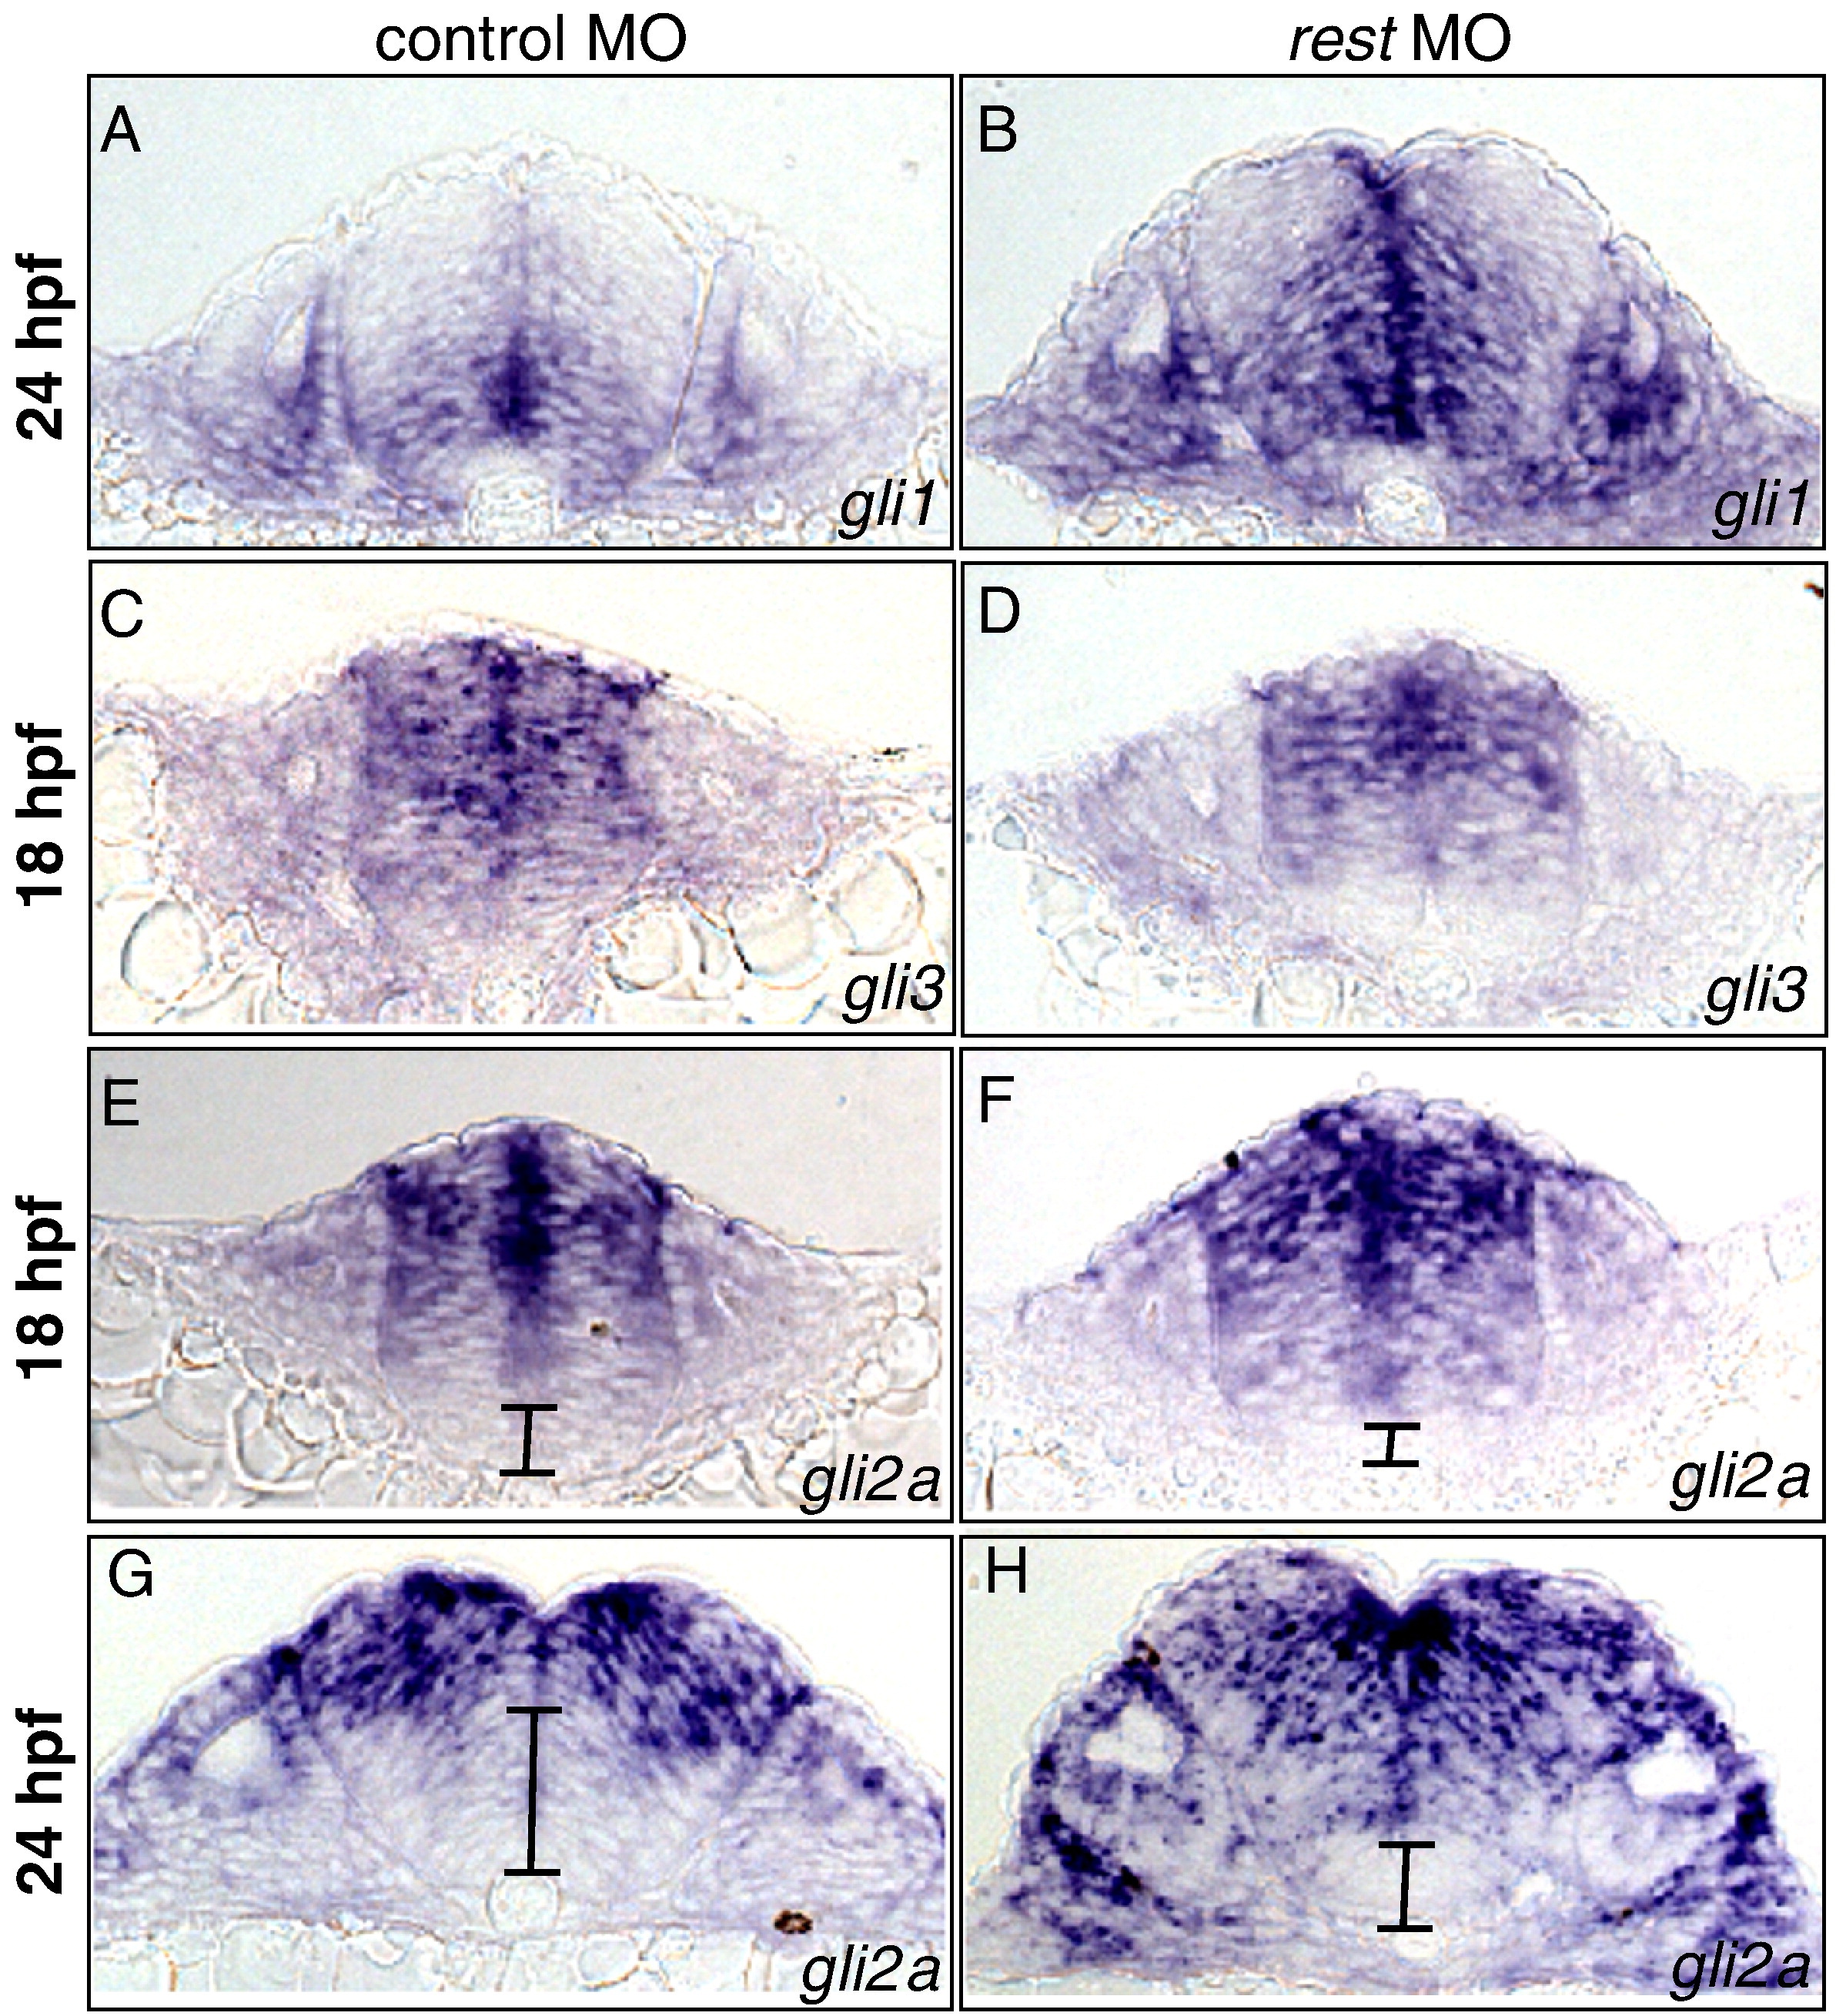
Figure Caption
Fig. 6 Rest represses gli2a expression. Transverse sections of the hindbrain of control (A, C, E, G) and stage-matched rest morphants (B, D, F, H). RNA in situ hybridization to monitor gli1 (A, B) gli3 (C, D) and gli2a (E–H) expression. (A, B) gli1 expression is enhanced by Rest knockdown. (C, D) gli3 expression is unaltered by Rest knockdown. (E, G) gli2a expression is downregulated ventrally and in the midline ventricular zone (vz) as development proceeds in control embryos. (F, H) gli2a expression is maintained in the vz and is expressed more ventrally in rest morphants.
Figure Data
Acknowledgments
This image is the copyrighted work of the attributed author or publisher, and
ZFIN has permission only to display this image to its users.
Additional permissions should be obtained from the applicable author or publisher of the image.
Reprinted from Developmental Biology, 340(2), Gates, K.P., Mentzer, L., Karlstrom, R.O., and Sirotkin, H.I., The transcriptional repressor REST/NRSF modulates hedgehog signaling, 293-305, Copyright (2010) with permission from Elsevier. Full text @ Dev. Biol.