
|
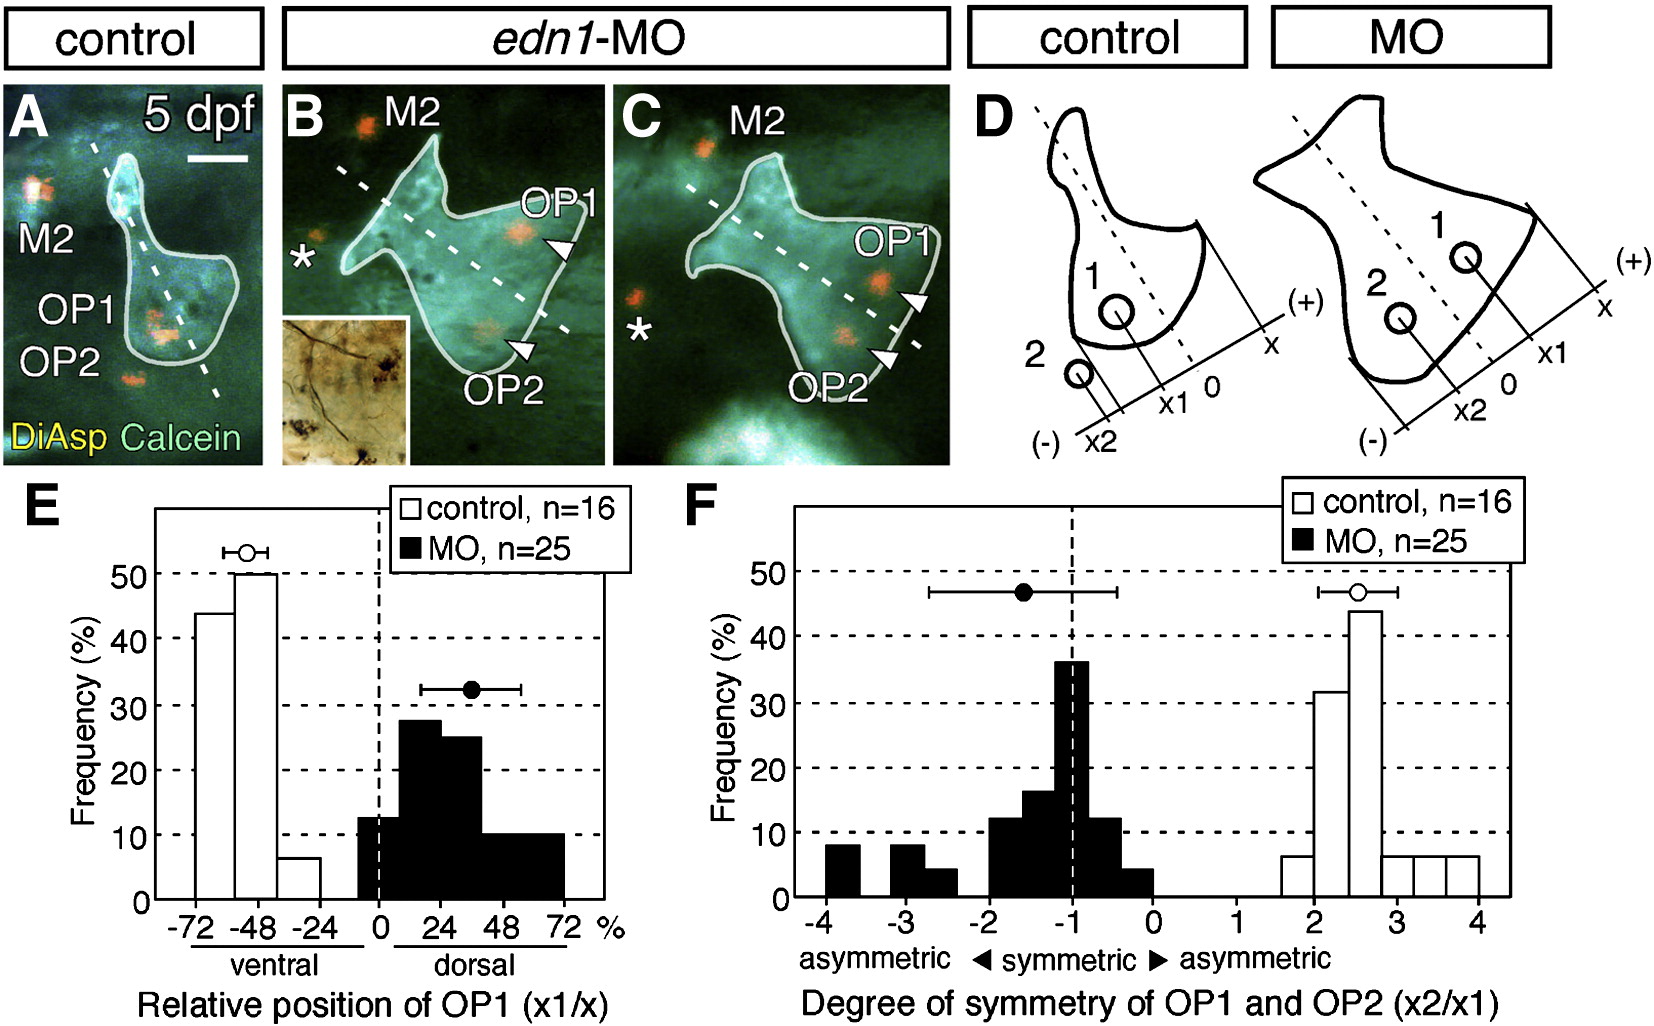
Fig. 5 Deficient neuromast patterning in endothelin 1-knockdown embryos. (A) Embryo doubly stained with DiAsp and Calcein demonstrate the position of the neuromasts at 5 dpf. (B, C) Opercle and neuromasts in embryos injected with edn1-MO. The ossified region of the opercle is outlined, and the opercle midline is indicated by the dotted line. Asterisks indicate unidentified neuromasts appearing ectopically. Inset in B shows the same embryo immunostained for acetylated α-tubulin. (D) Schematic drawing for quantification of the neuromast distribution. Positions of the dorsal edge of the opercle (x), OP1 (x1) and OP2 (x2) are measured relative to the line of opercle symmetry (0). Positive or negative values define positions dorsal or ventral to the midline, respectively. (E) Position of OP1 relative to the opercle in edn1-MO larvae. The relative position of OP1 is defined as the ratio of x1/x (expressed as %). (F) Symmetrical distribution of the neuromasts with respect to the midline of the opercle in the morphant embryos. The degree of symmetry is defined as the ratio of x2/x1. When OP1 and OP2 are located symmetrically with respect to the midline, the degree of symmetry equals - 1. Mean ± SEM are indicated respectively by the circles and bars on top of the graph. Scale bar: 50 μm.
Reprinted from Developmental Biology, 340(2), Wada, H., Ghysen, A., Satou, C., Higashijima, S.I., Kawakami, K., Hamaguchi, S., and Sakaizumi, M., Dermal morphogenesis controls lateral line patterning during postembryonic development of teleost fish, 583-594, Copyright (2010) with permission from Elsevier. Full text @ Dev. Biol.