
|
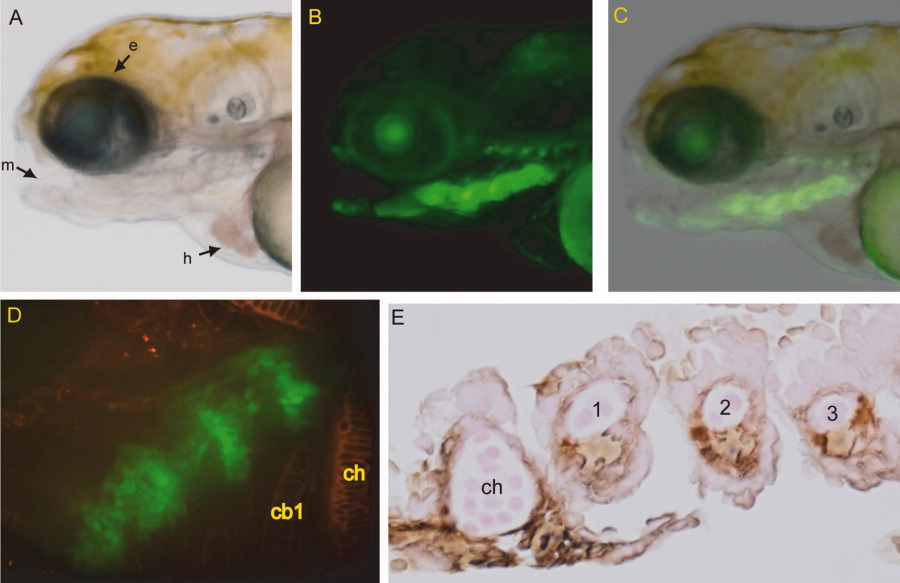
Fig. 5 ECR5 drives transgene expression in a subset of the pharyngeal arches in context of the minimal cFOS promoter. A: Lateral brightfield image of ECR5 transgenic zebrafish larva at 4 days postfertilization (dpf). B: Fluorescent image of ECR5 transgenic at 4 dpf showing transgene expression in a subset of the pharyngeal arches. The faint line of signal dorsal to the arches was due to autofluorescence and not transgene expression, as revealed by staining with anti-GFP antibody (not shown). C: Overlay of brightfield and fluorescent ECR5 transgene expression. D: Ventral view of ECR5 transgene expression (green). Anterior is at top right. Wheat germ agglutinin labeling of cartilage (red) shows that transgene expression does not overlap with mature cartilage of the flanking ceratohyals. E: Immunohistochemistry for GFP on a ECR5 transgenic 4 dpf embryo sagittal section shows that transgene (brown) is not expressed in internal chondrocytes within cartilage elements but is restricted to perichondrium and cells between elements. e, eye; m, mouth; h, heart; ch, ceratohyal cb1, ceratobranchial 1.