
|
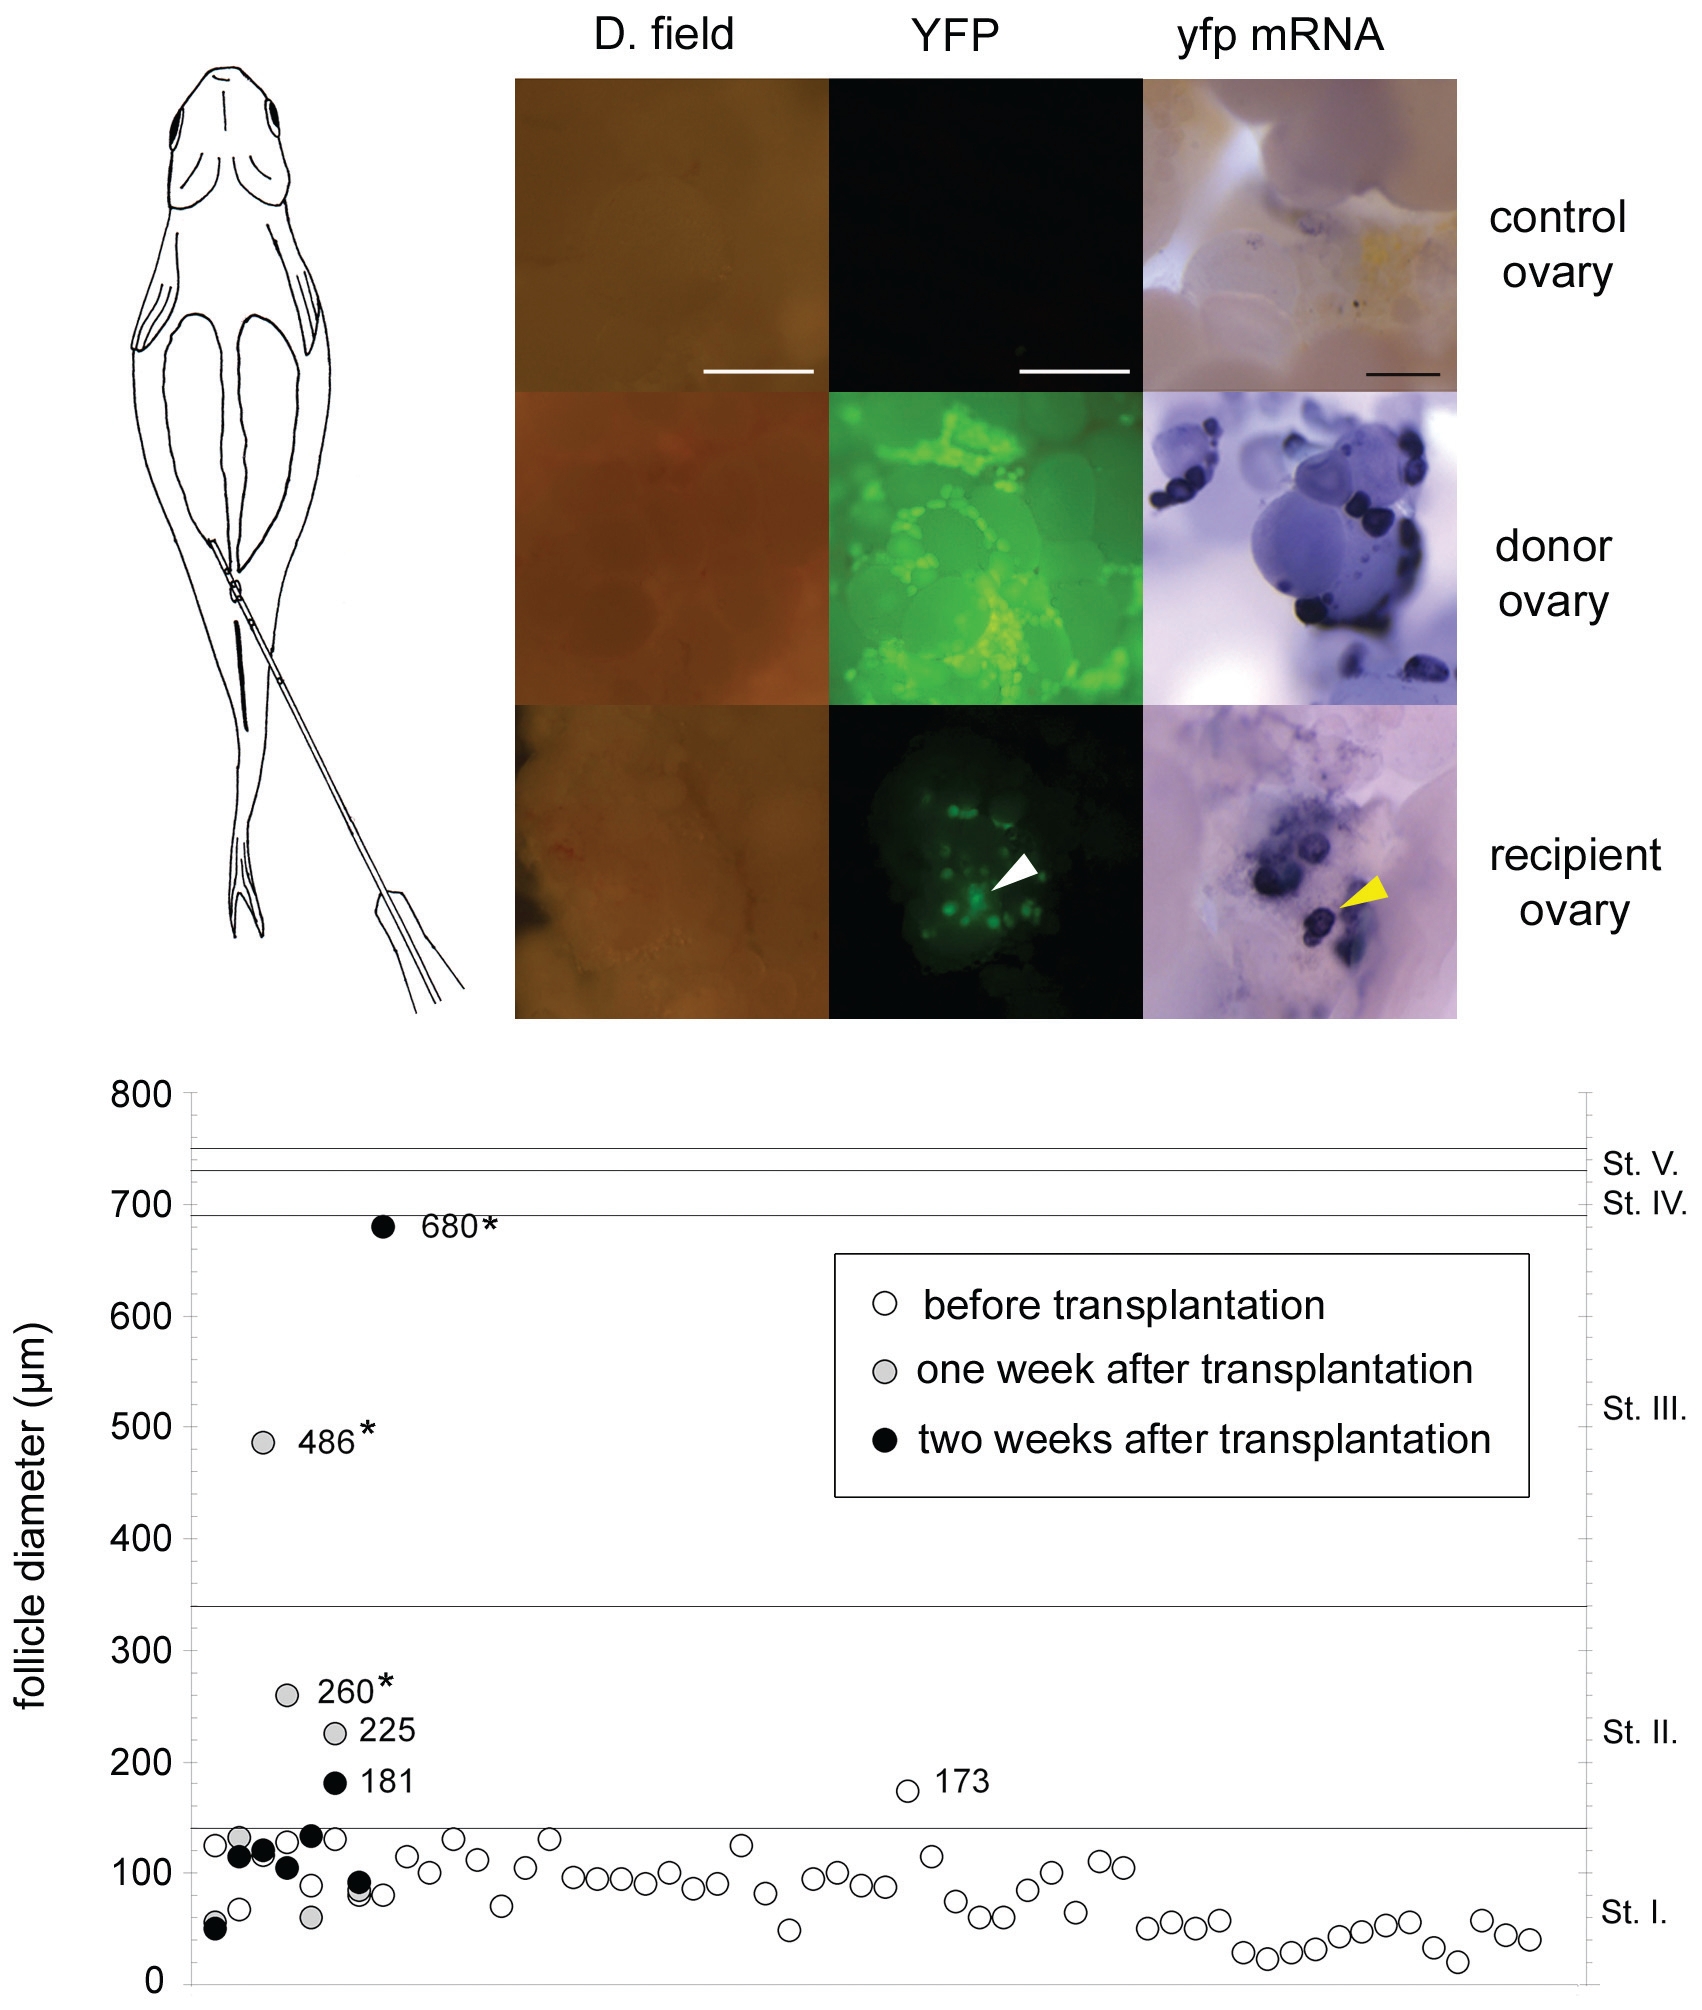
Fig. 1 Transplanted follicles invade the recipient ovary and continue oocyte development. (A), Schematic picture of the process of transplantation. (B-D), Intrauterine injection of stage I follicles results in the appearance of transplanted donor oocytes/follicles in the non-transgenic host ovary. dark field (left), YFP filter view (middle) and whole mount in situ hybridisation analysis (right) of ovaries. Transgenic donor follicles are yellowish green in GFP filter view (C) and purple in the whole mount hybridisation analysis, while no YFP signal is detected in wild type recipient ovaries without transplantation (B). (D), transplanted follicles are indicated by arrowheads among non-transgenic host follicles in a recipient ovary. (E), Size distribution of follicles (in μm) before transplantation and after recovery from recipient ovaries. Asterisks indicate values of donor follicles recovered from recipient ovaries that are significantly different from the donor follicles measured before transplantation (Kruskal-Walis test, P≤0,05). Scale bar indicates 300 μm.