
|
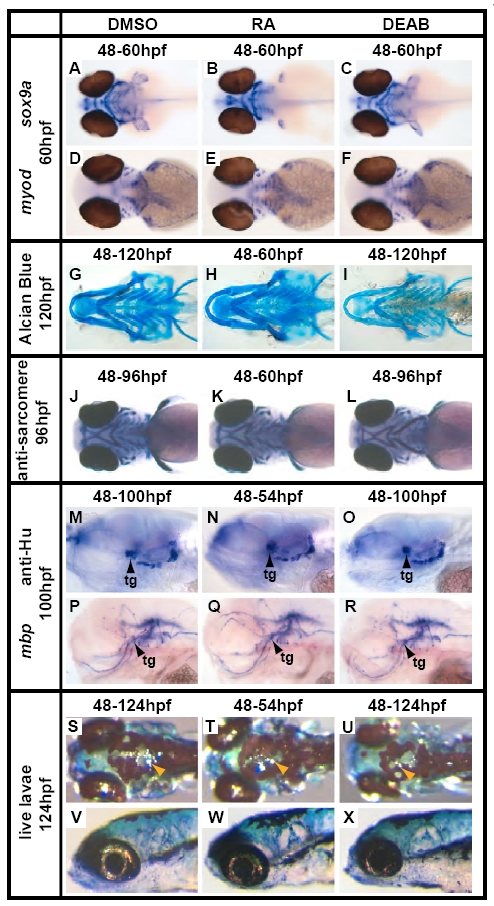
Fig. S4 RA and DEAB treatments commencing at 48 hpf do not have a strong affect on the differentiation of other cephalic neural crest derivatives or of muscle. (A-C) Ventral views of sox9a (SRY box containing gene 9a) expression showing that treatments from 48-60 hpf do not affect chondrocyte specification. sox9a marks chondrocytes and is a key regulator of chondrogenesis. (D-F) Dorsal views of myoD (myogenic differentiation 1) expression showing that treatments from 48-60 hpf do not affect myocyte specification. myod marks muscle precursors and is a key regulator of myogenesis. (G-I) Ventral views of Alcian Blue-stained fish showing that treatments do not affect the cartilaginous skeleton. (J-L) Ventral views of antibody staining (mf20, Developmental Studies Hybridoma Bank) for muscle showing that treatments do not affect cephalic muscle. (M-O) Side views of antibody staining (anti-HU, Molecular Probes) for neurons showing that treatments do not affect cranial ganglia (tg, trigeminal ganglion). (P-R) Side views of mbp (myelin basic protein) expression showing that glial differentiation is not affected by treatments. (S-U) Dorsal views of live zebrafish showing the presence of melanophores (black cells) and iridophores (silver cells indicated by yellow arrows). (V-X) Side views of live zebrafish showing the presence of xanthophores (blue cells). Zebrafish were raised in 0.0001% Methylene Blue in order to visualize xathophores (Le Guyader and Jesuthasan, 2002).