
|
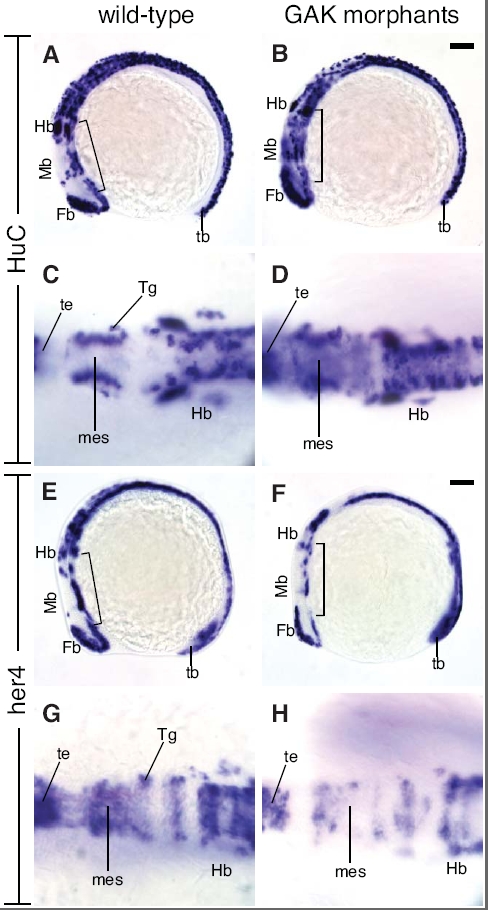
Fig. S2 Expression patterns of HuC and Her4 in wild-type and GAK morphant embryos at the 10-somite stage. (A, B) Lateral views of HuC expression in (A) wild-type and (B) GAK morphant embryos at the 10-somite stage. Similar to the 8-somite stage, more cells appeared to express HuC in GAK morphant embryos at the 10-somite stage, suggesting the presence of more neuronal cells. (C-D) Close-up top views of HuC expression in the brain regions (indicated by brackets in A&B) of (C) wild-type and (D) GAK morphant embryos. (E, F) Lateral views of Her4 expression patterns in (E) wild-type and (F) GAK morphants at the 10-somite stage. At this stage, Her4 expression in GAK morphant embryos appeared reduced, as compared to the wild type. (G-H) Close-up top views of Her4 expression in the brain regions (indicated by brackets in E&F) of (G) wild-type and (H) GAK morphant embryos. In all the panels, anterior is to the left, and in all the lateral views, dorsal is up. Fb, forebrain; Hb, hindbrain; Mb, midbrain; mes, mesencephalon; te, telencephalon; Tg, Trigeminal ganglion; tb, tailbud. Scale Bar, 100 μm.