
|
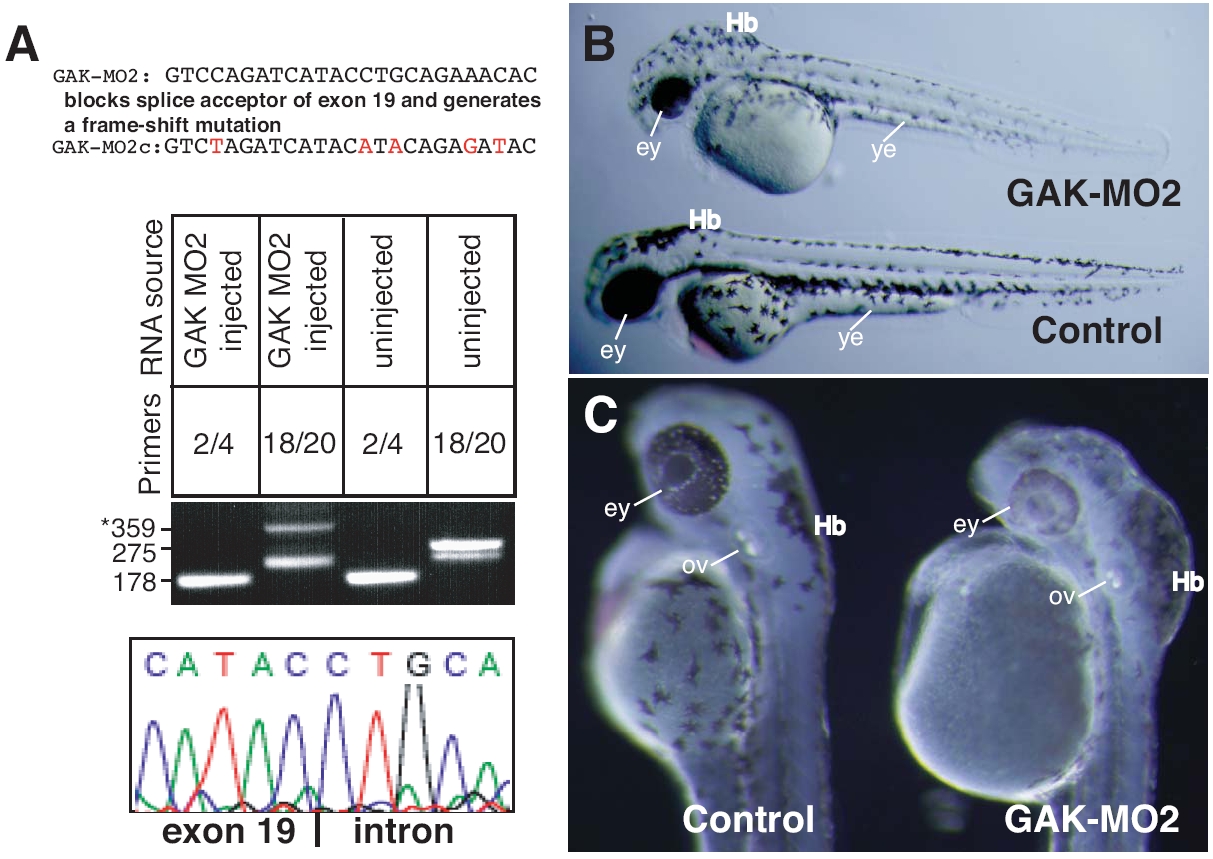
Fig. S1 The phenotypes of GAK-MO2 morphants are similar to those of GAK-MO1 morphants. (A) RT-PCR analysis of the total RNA from embryos injected with GAK-MO2. Using the RNA prepared from uninjected embryos, a 2/4 reaction (using primers complementary to exon 2 and 4) yielded a band of 178 bp, and an 18/20 reaction yielded a band of 275 bp and a slightly smaller non-specific band. On the other hand, using the RNA prepared from GAK-MO2 morphants, the 178 bp band was unaffected. However, the 275 bp band was absent (the non-specific band was unaffected) and a new band of 359 bp appeared. Sequence analysis of this 359 bp band revealed that the injection of GAK-MO2 caused the retention of intron 18, resulting in a frame-shift truncation in the PTEN region (immediately after Lys679). (B, C) Lateral views of uninjected and GAK-MO2 morphants at 36 hpf. In (B), anterior is to the left and dorsal is up, and in (C), anterior is up and dorsal is to the right. ey, eye; Hb, hindbrain; ov, otic vesicles; ye, yolk extension. Scale Bar, 100 μm.