
Image
|
Figure Caption
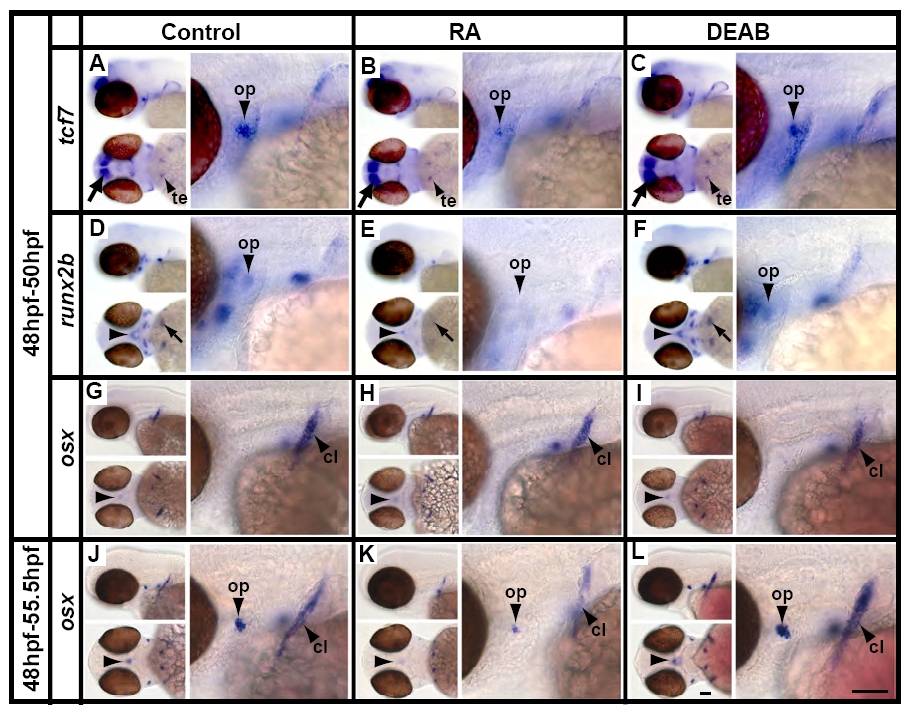
Fig. S2 RA signalling affects gene expression within 2 hours of treatment. (A-I) Whereas expression of tcf7 (A-C) and runx2b (D-F) is reduced after 2 hours of RA treatment, osx shows little change (G-I). osx is not expressed in the opercle at this time point. We do not see precocious expression of osx in the opercle after DEAB treatment, nor do we see affects on the cleithrum and parasphenoid expression after DEAB or RA treatments. (J-L) After 7.5 hours of treatment, osx shows a strong response to treatment. Panels are arranged and annotated as in Fig. 2.
Acknowledgments
This image is the copyrighted work of the attributed author or publisher, and
ZFIN has permission only to display this image to its users.
Additional permissions should be obtained from the applicable author or publisher of the image.
Full text @ Development