
|
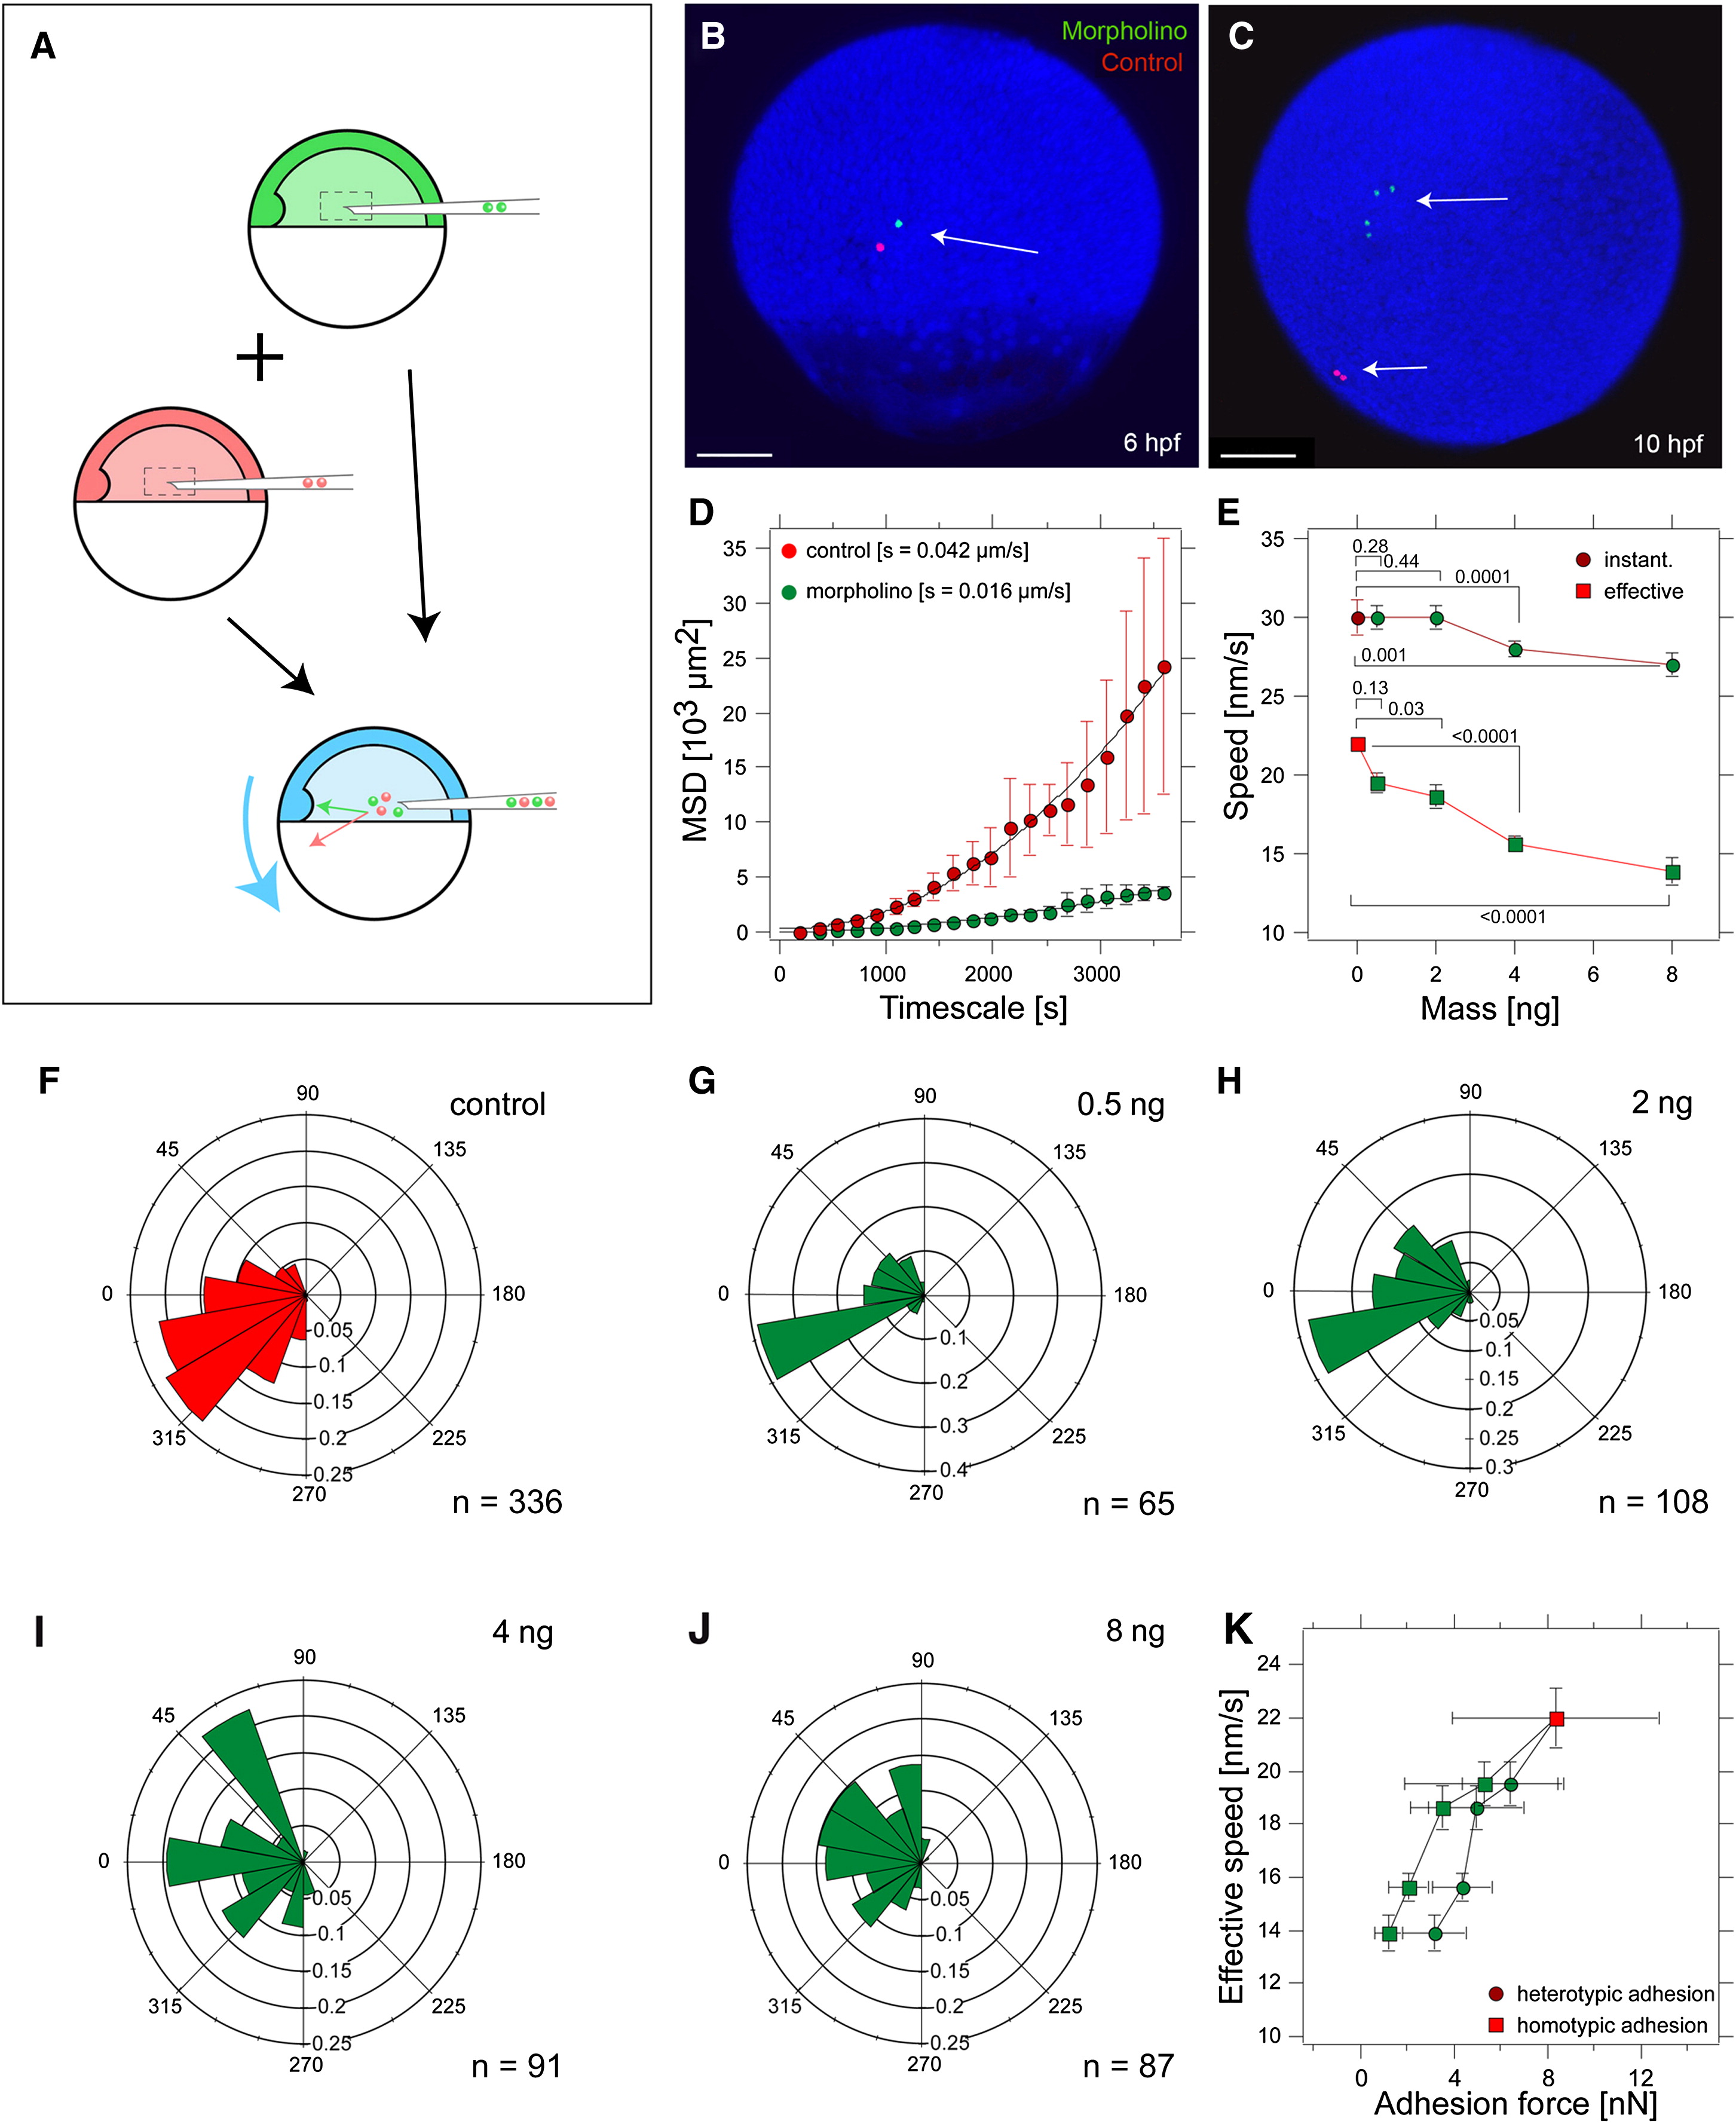
Fig. 4 Effect of Cell-Cell Adhesion on Individual Mesendoderm Cell Movement
(A) Schematic representation of the transplantation experiment. Cells from donor embryos (red, control; green, e-cadherin morphant) are transplanted into a host WT embryo (blue) at 50% epiboly (5 hpf). The movement of the cells until the end of gastrulation (10 hpf) was monitored by time-lapse confocal microscopy.
(B and C) Transplanted e-cadherin morphant (green) and WT control (red) cells at the onset of gastrulation (6 hpf; B) and at the end of gastrulation (10 hpf; C). Arrows point to transplanted cells.
(D) MSD plot of e-cadherin morphant and WT control cells.
(E) Average instantaneous (circles) and average effective (squares) movement speed for WT control (red) and e-cadherin morphant (green) cells. Error bars represent standard error of the mean. p values determined by t test are shown above or below the brackets.
(F–J) Movement orientation of WT control (red; F) and e-cadherin morphant (green) cells injected with 0.5 ng (G), 2 ng (H), 4 ng (I), and 8 ng (J) e-cadherin morpholino (MO) per embryo represented as angular histograms. Angles were calculated with respect to the dorsal-pointing vector originating from the embryo center. n represents number of analyzed cells.
(K) Average effective movement speed (mean ± standard error of the mean) as a function of the heterotypic and homotypic adhesion force (median ± MAD) of WT control (red) and e-cadherin morphant (green) cells as measured in Figure 2D (60 s contact time). n represents number of analyzed cells.