
|
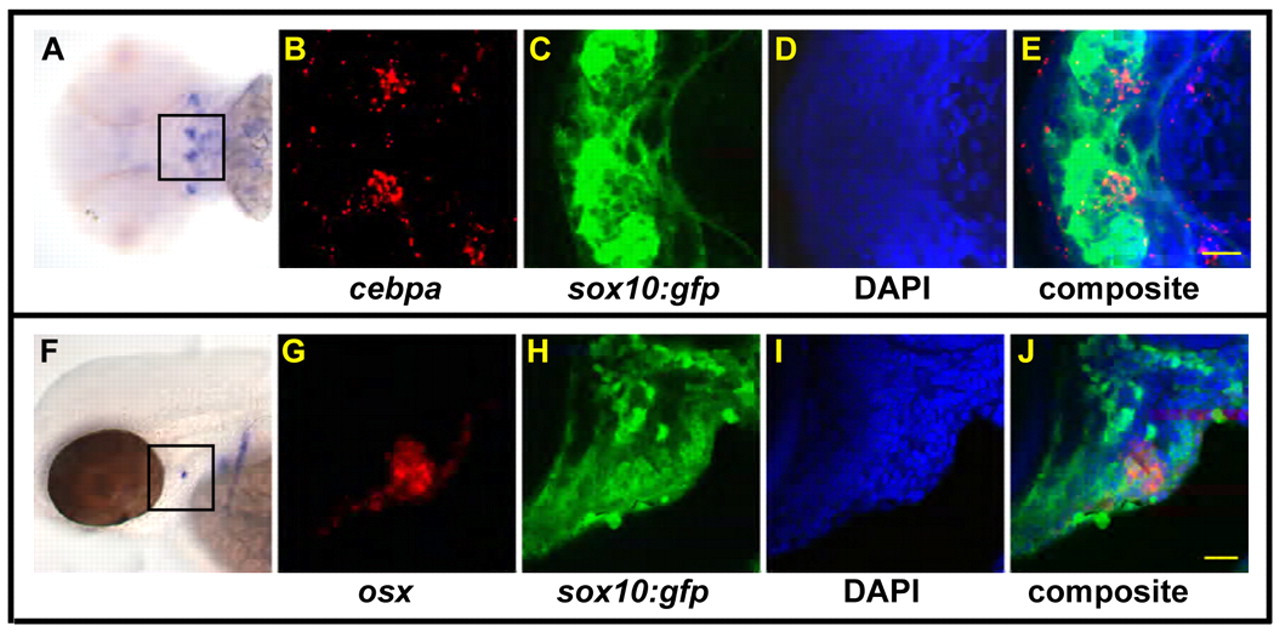
Fig. 4 Cephalic neural crest gives rise to adipocytes and osteoblasts. (A-E) cebpa and sox10:gfp are co-expressed in the same cells at 54 hpf. (A) Ventral view of a zebrafish embryo with cebpa detection by chromogenic substrate. The boxed area indicates the region shown in B-E. cebpa (B) and sox10:gfp (C) are co-expressed in the same cells (overlay in E). The nuclear dye DAPI is used as a counterstain to show that not all cells express each marker and that the optical sections are less that one cell diameter (D). (F-J) osx and sox10:gfp are co-expressed in the same cells at 54 hpf. (F) Side view of a fish with osx detection by chromogenic substrate. The boxed area indicates the region shown in G-J. osx (G) and sox10:gfp (H) are co-expressed in the same cells (overlay in J). (I) Staining with the nuclear dye DAPI. Scale bars: 10 μm.