
|
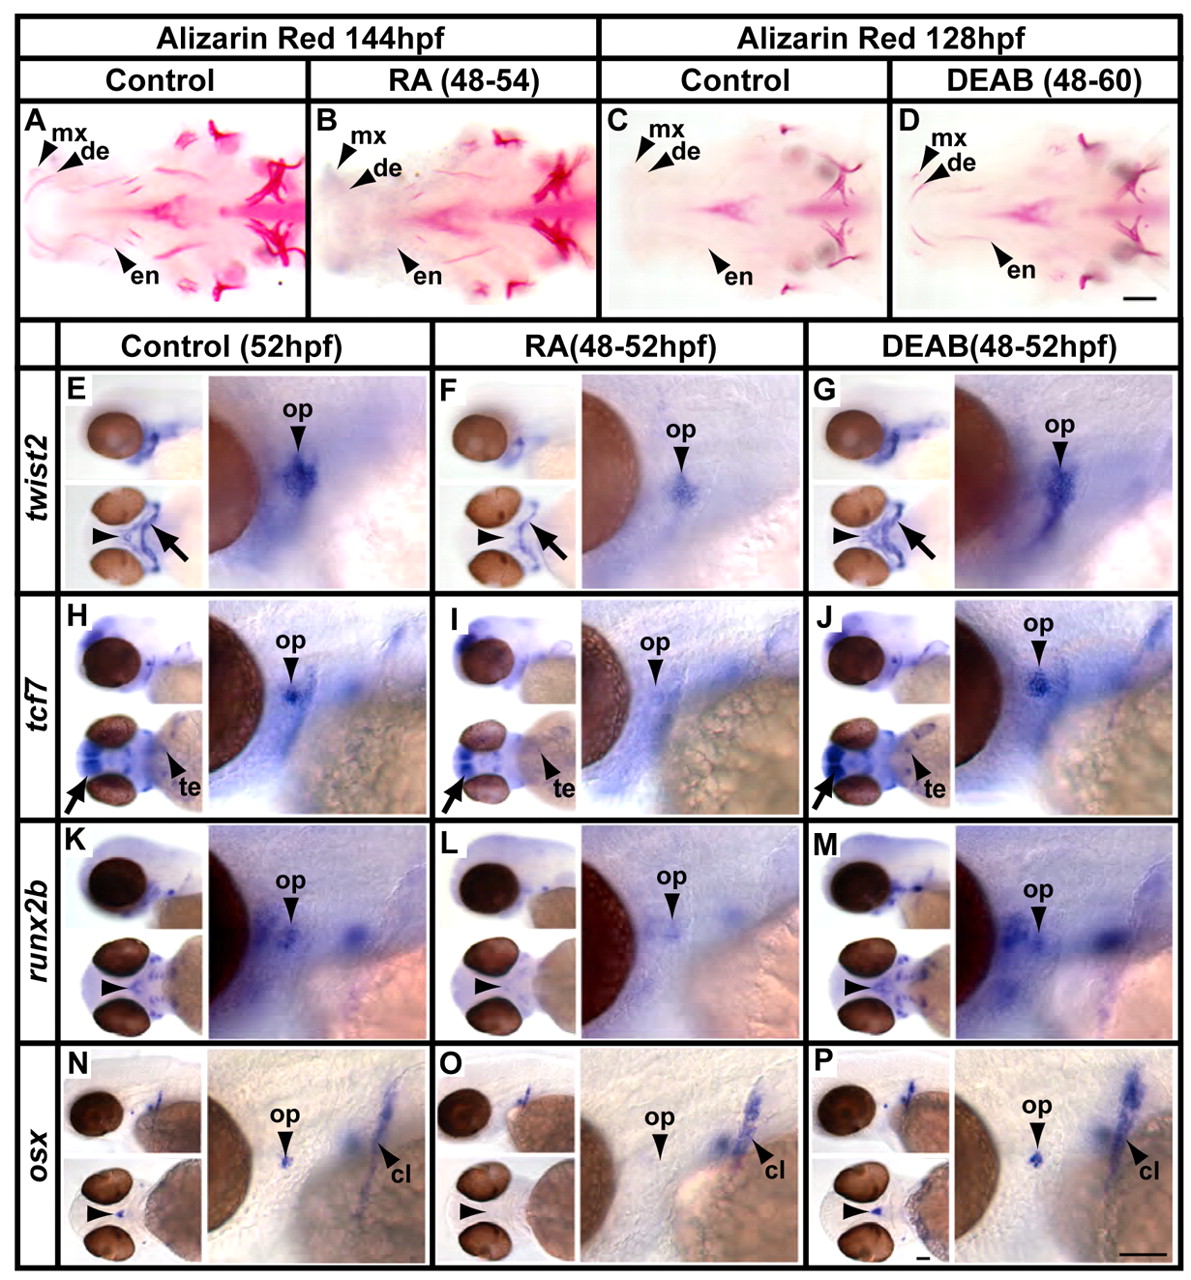
Fig. 3 RA signalling blocks early osteoblast differentiation. (A-D) Alizarin Red staining at 144 hpf shows that normal levels of ossification (A) are reduced by RA pulse treatment from 48-54 hpf (B). Alizarin Red staining at 128 hpf shows that pulse treatment with DEAB at 10 μM (D) enhances ossification when compared with control fish (C). Arrowheads point to the maxilla (mx), dentary (de) and entopterygoid (en) (which are all dermal bones). The eyes have been removed for clarity. Quantification for these experiments is shown in Tables S2 and S3 in the supplementary material. (E-P) Expression of twist2, tcf7, runx2b and osx is reduced by RA treatment (F,I,L,O) and enhanced by DEAB treatment (G,J,M,P) as compared with the control (E,H,K,N). Each panel shows side and dorsal views at low magnification (left) and a high-magnification side view of the opercle condensation (right). In the control, twist2 (E) is expressed strongly in the opercle (op), entopterygoid (not shown) and parasphenoid (arrowhead), as well as broadly in the distal region of the second arch (arrow). tcf7 (H) is expressed in the opercle and teeth (te), as well as in the brain (arrow). runx2b (K) is expressed in the opercle and parasphenoid, as well as in other skeletal elements. osx (N) is expressed in the opercle, parasphenoid, cleithrum (cl) and teeth (not shown). Scale bars: 50 μm.