
|
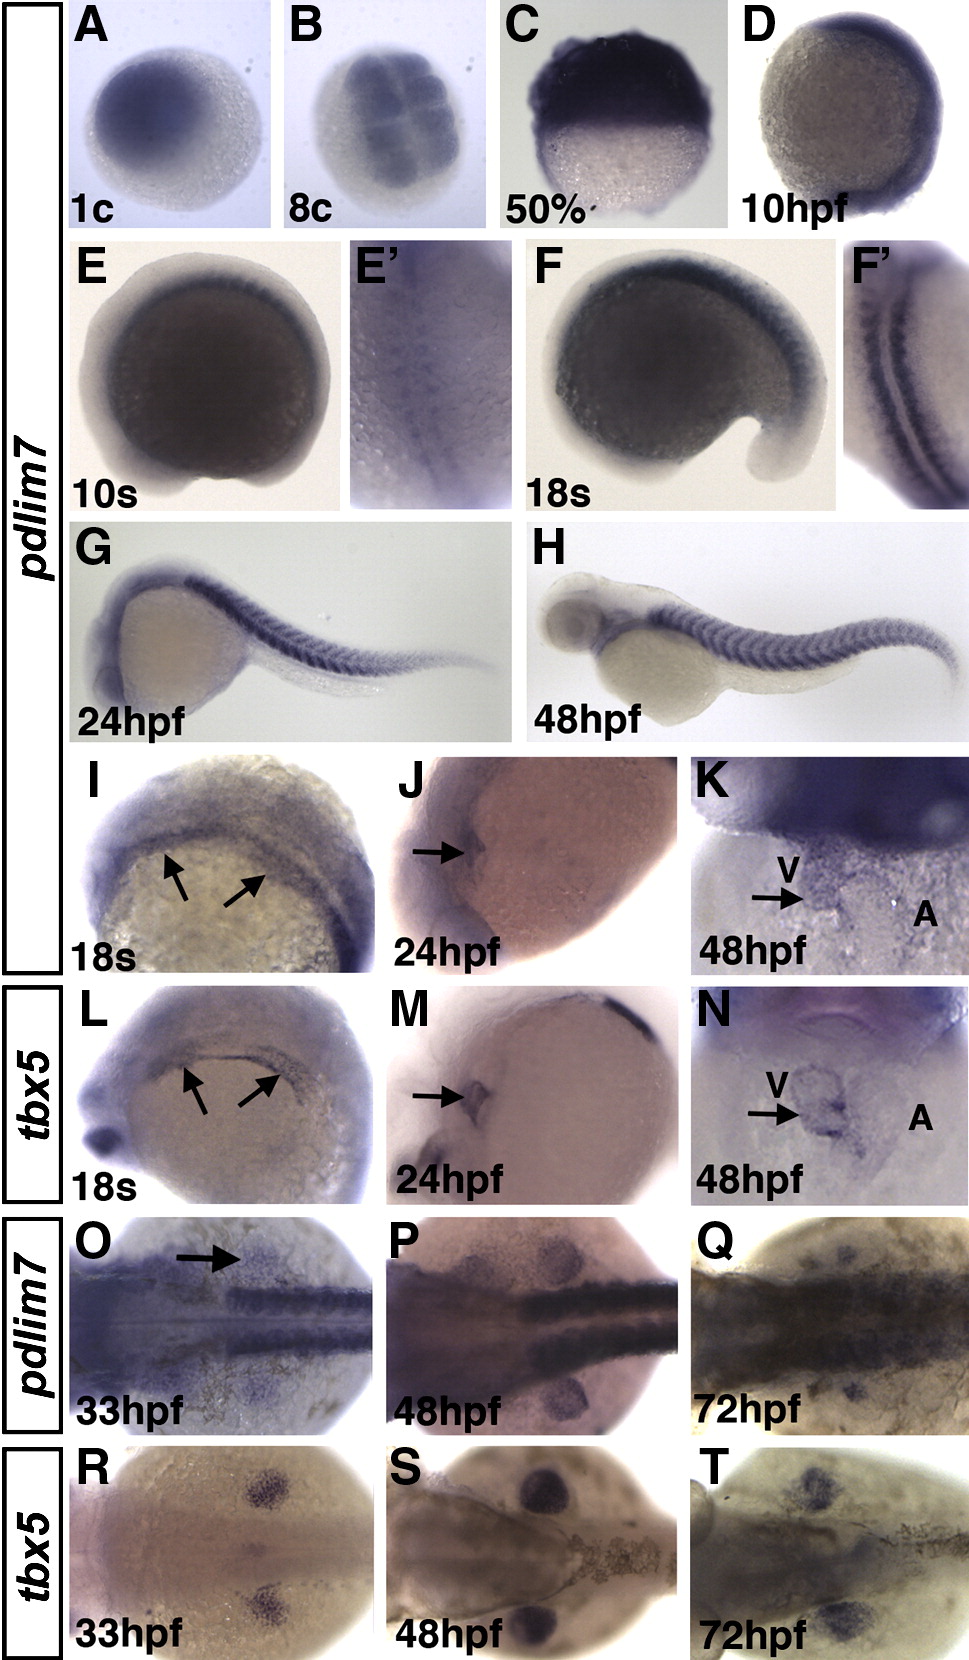
Fig. 1 Spatial and temporal expression of zebrafish pdlim7. (A–H) pdlim7 mRNA at (A) 1-cell and (B) 8-cell stages. (C) 50% epiboly. (D) 10 h post-fertilization (hpf). (E) 10-somites. (E′) dorsal view of embryo in E. (F) 18-somites. (F′) dorsal view of embryo in F. Anterior is toward the top in E′ and F′. (G, H) Lateral views of 24 and 48 hpf, respectively. (I–N) pdlim7 (I–K) and tbx5 (L–N) cardiac expression. (I, L) 18-somites stage. (J, M) 24 hpf, (K, N) 48 hpf. Arrows depict expression in cardiac and pectoral fin precursors of the lateral plate mesoderm. (O-T) Expression of pdlim7 (O–Q) and tbx5 (R–T) in the mesenchyme during pectoral fin development. V = ventricle. A = atrium.
Reprinted from Developmental Biology, 337(2), Camarata, T., Krcmery, J., Snyder, D., Park, S., Topczewski, J., and Simon, H.G., Pdlim7 (LMP4) regulation of Tbx5 specifies zebrafish heart atrio-ventricular boundary and valve formation, 233-245, Copyright (2010) with permission from Elsevier. Full text @ Dev. Biol.