
Image
|
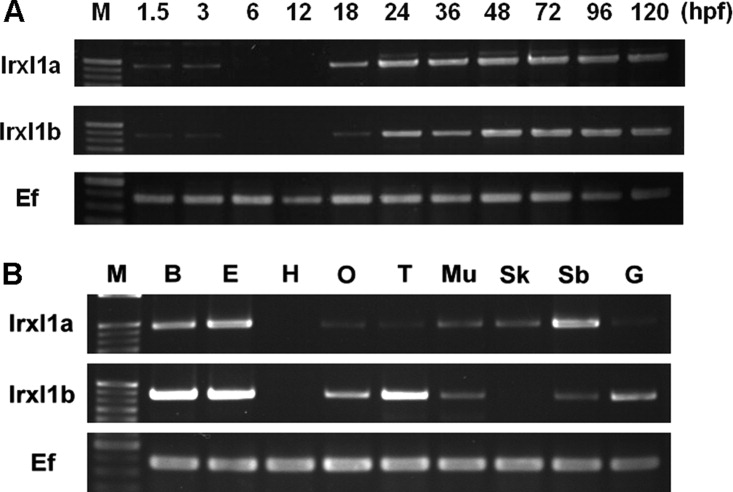
Figure Caption
Fig. 2 Expression profiles of irxl1 by reverse transcriptase-polymerase chain reaction (RT-PCR). A: Expression of irxl1 in developing fish embryos at indicated time points. hpf, hours postfertilization. B: Expression of irxl1 in adult zebrafish tissues. irxl1a, 964 bp; irxl1b, 875 bp. M, DNA markers; B, brain; E, eye; H, heart; O, ovary; T, testes; Mu, muscle; Sk, skin; Sb, swim bladder; G, gill. Amplification of elongation factor (Ef) was used as an internal control.
Figure Data
Acknowledgments
This image is the copyrighted work of the attributed author or publisher, and
ZFIN has permission only to display this image to its users.
Additional permissions should be obtained from the applicable author or publisher of the image.
Full text @ Dev. Dyn.