
|
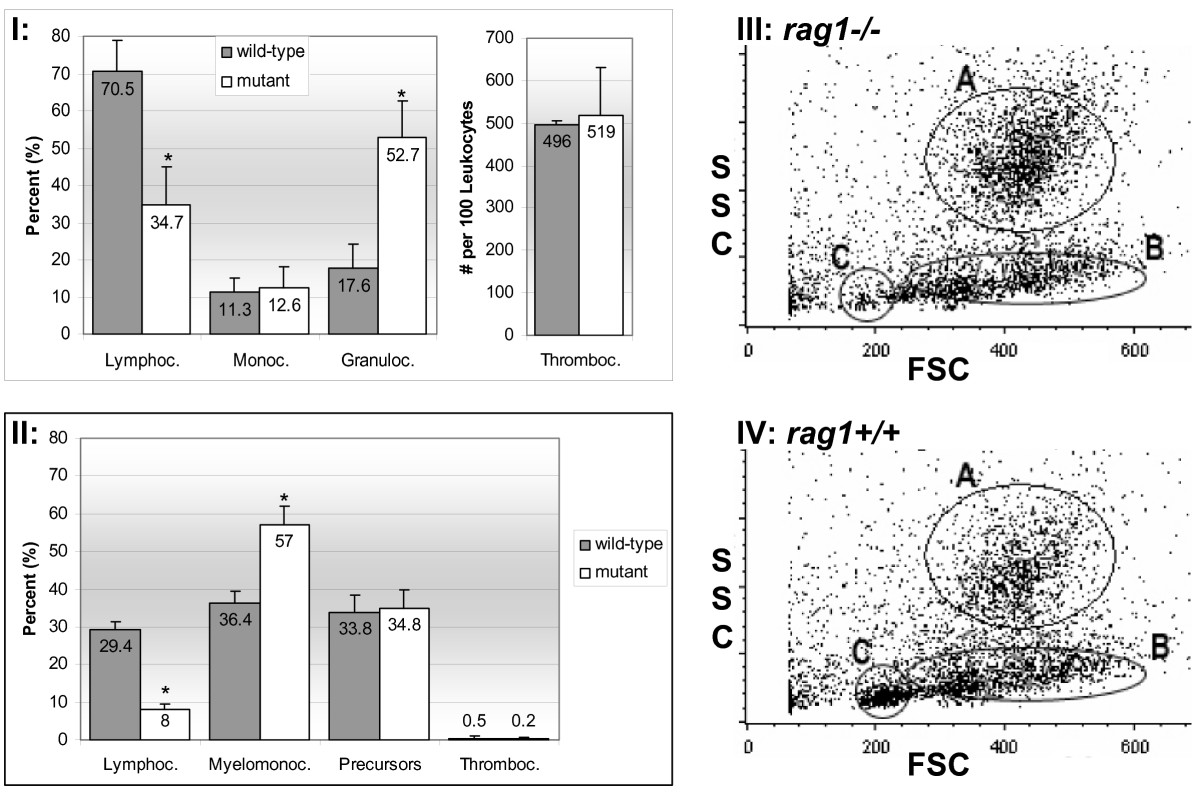
Fig. 1 Mutant and wild-type zebrafish leukocyte differentials and flow cytometry scatter plots. I and II represent differential counts on peripheral blood smears and kidney hematopoietic tissue smears, respectively. Asterisks indicate significant difference between wild-type and mutant blood cells within the specific population. Average percentage ± standard deviation from 10 replicates is shown (p ≤ 0.05). III and IV show graphs of flow cytometric results on cells from mutant and wild-type kidney tissues, respectively. Graphs represent pooled data from 4 runs on 4 separate mutant and wild-type fish. Forward scatter (FSC) and side scatter (SSC) analyses of whole kidney cell suspension differentiates three distinct cell populations: A-macrophage/monocytes and granulocytes, B-hematopoietic precursor cells and C-lymphocytes and lymphocyte-like cells. Note the reduction in gate C, characteristic of lymphocytes and lymphocyte-like cells, in mutant kidney cell suspensions.