
|
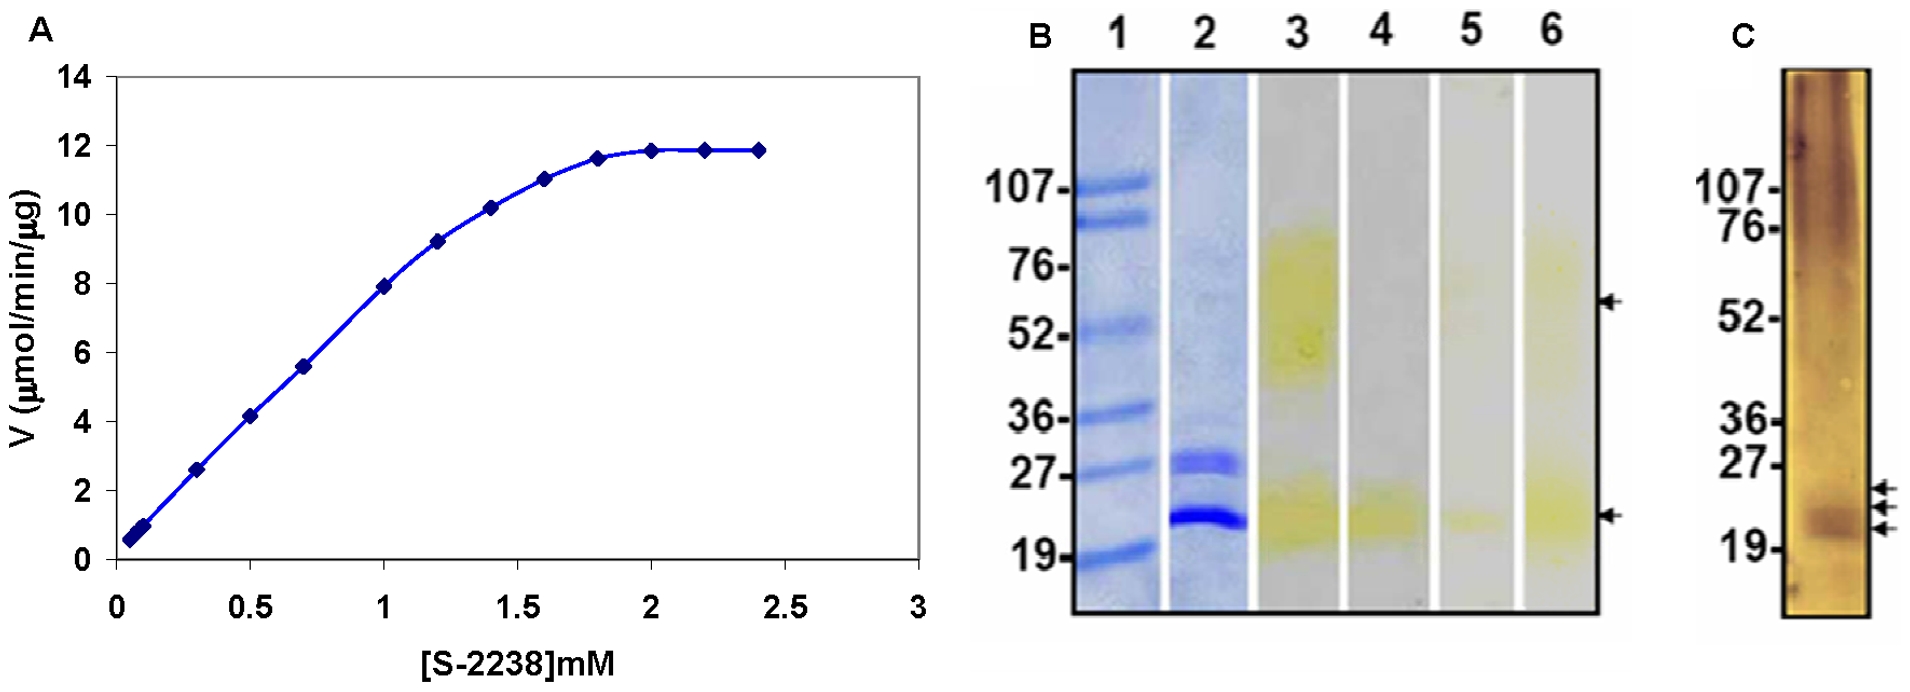
Fig. 1 Protease activity in zebrafish water samples.
(A) Michaelis-Menten plot with velocity as a function of [S-2238]. Each sample was maintained for 30 min prior to mixing with substrate under the specified conditions. Standard error bars (±0.07) were removed to improve clarity of each graph. (B) The proteins secreted by zebrafish were separated on a 5–20% Tris-glycine SDS-polyacrylamide gradient gel. The samples loaded in the lanes are as follows: 1, molecular weight marker (numbers on the left side indicate the size of the band in kDa); 2, 3, ZW; 4, zebrafish mouth wash; 5, zebrafish nose wash; and 6, zebrafish gill wash. Lanes 1 and 2 were stained with Coomassie blue dye. Other lanes were stained using 10 mM S-2238 following renaturation. Arrows indicate protease activity. (C) Western blot analysis of ZW. Arrows indicate trypsins. The numbers on the left side indicate the size of the molecular weight markers in kDa.