
|
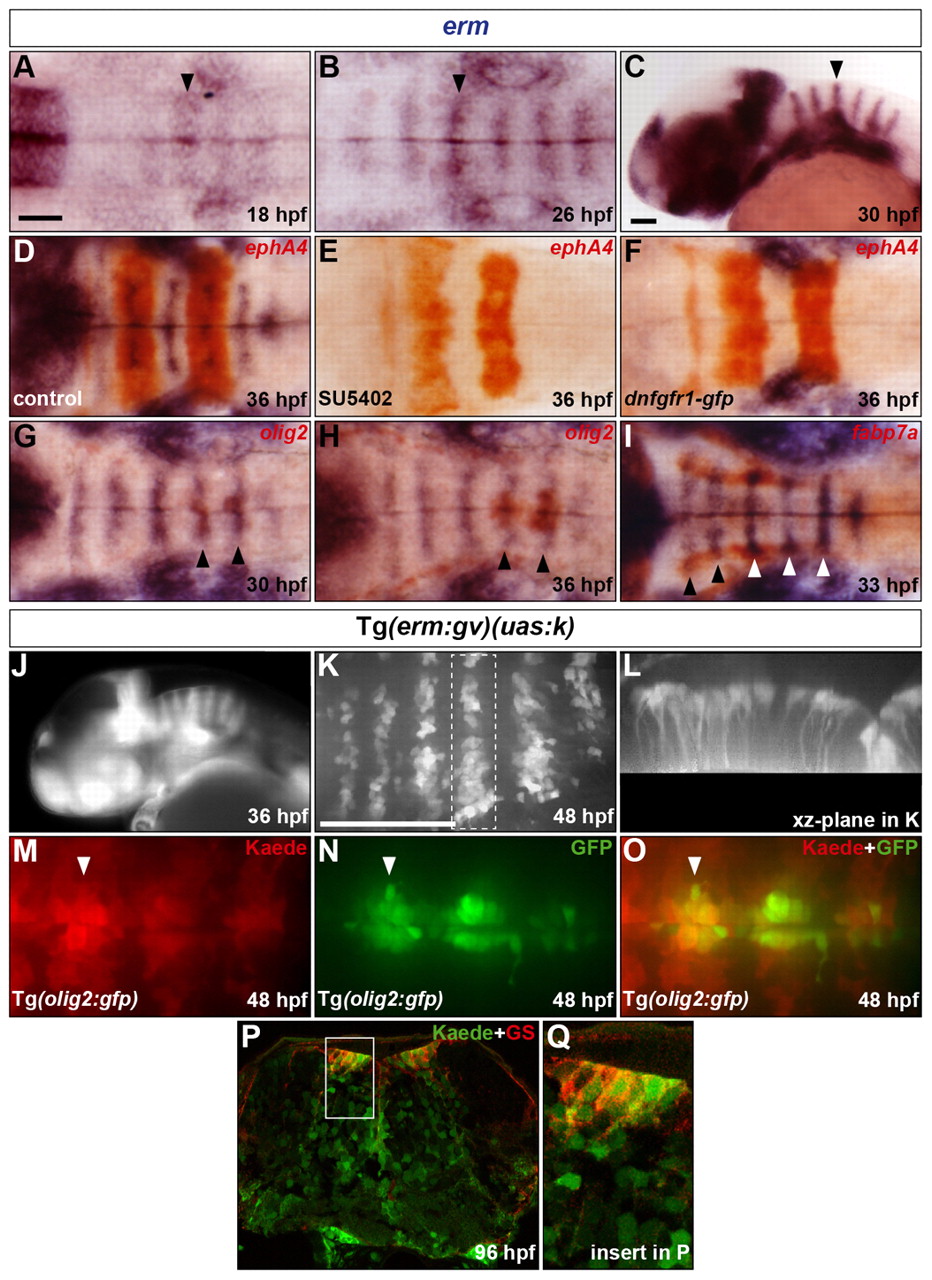
Fig. 2 Presence of an FGF-receptor signal in progenitors of hindbrain SMNs, OLPs and GS-positive astroglia. (A-C) Evolution of erm RNA expression in the hindbrain from 18 to 30 hpf. Arrowheads indicate the centre of r4. (D-F) Embryos were analysed at 36 hpf for erm (blue) and ephA4 (red) RNA expression. Wild-type embryos were either treated with DMSO (D) or with SU5402 at 20 hpf (E) and Tg(hsp70l:dnfgfr1-gfp) embryos were heat shocked at 20 hpf (F). (G-I) Embryos were analysed for erm (blue) and olig2 (G,H) or fabp7a (I) (red) RNA expression at 30 (G), 36 (H) and 33 (I) hpf. Arrowheads indicate the centre of r5 and r6 (G,H) or r2-r6 (I). (J) Kaede fluorescence profile in a Tg(erm:gv)(uas:k) embryo at 36 hpf. (K,L) Kaede of a 46 hpf Tg(erm:gv)(uas:k) embryo was completely photoconverted and the embryo was allowed to develop to 48 hpf and was analysed for de novo Kaede fluorescence. Images show half the hindbrain in dorsal (K) and xz-plane of r5 (L). (M-O) Kaede of a 48 hpf Tg(erm:gv)(uas:k)(olig2:gfp) embryo was completely photoconverted and analysed for Kaede (M,O; red) and GFP (N,O; green) fluorescence. The arrowhead indicates the centre of r5. (P,Q) Transverse hindbrain section at the level of the otic vesicle of a Tg(erm:gv)(uas:k) embryo at 96 hpf analysed for Kaede fluorescence (green) and immunolabelling for GS (red). The framed area in P is shown at higher magnification in Q. Embryos are oriented with anterior to the left, in dorsal (A,B,D-I,K,M-O) or lateral (C,J) view. Scale bars: 50 μm.