
|
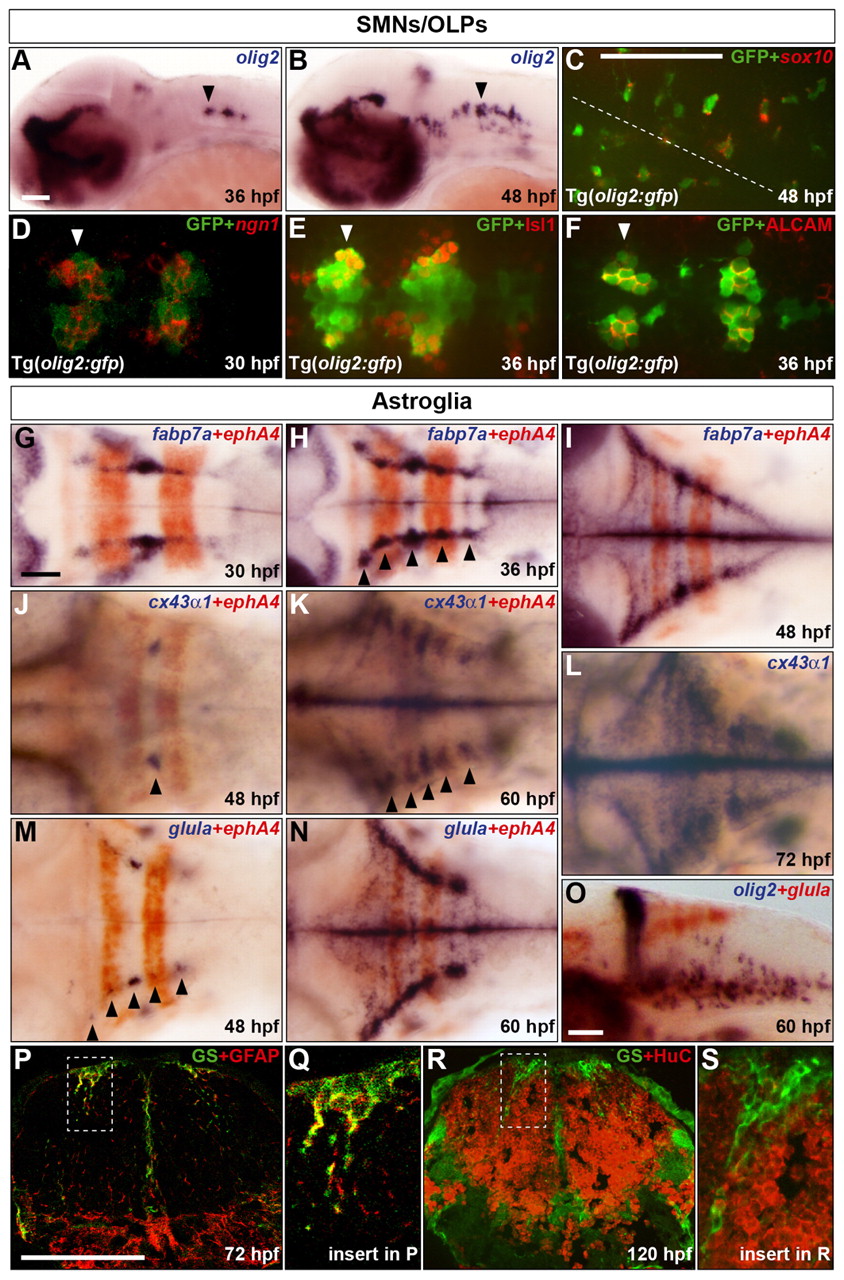
Fig. 1
Characterisation of the development of SMNs, OLPs and astroglia in the zebrafish hindbrain. (A,B) Embryos were analysed for olig2 RNA expression at 36 (A) and 48 (B) hpf. (C-F) Co-expression of GFP protein (green) in Tg(olig2:gfp) line and sox10 (C) or ngn1 (D) RNA and Isl1 (E) or ALCAM (F) protein (red) at 48 (C), 30 (D) and 36 (E,F) hpf. In C the position of the midline is indicated by a dashed line. (D-F) Ventromedial r5-7. Arrowheads indicate r5 (A,B,D-F). (G-O) Wild-type embryos were analysed for RNA expression of fabp7a at 30 (G), 36 (H) and 48 (I) hpf, cx43α1 at 48 (J), 60 (K) and 72 (L) hpf and glula at 48 (M) and 60 (N,O) hpf. Embryos were double labelled for ephA4 (red) RNA to mark r3 and r5 (G-K,M,N) or olig2 (blue) (O). Arrowheads indicate dorsolateral r4 (J) and r2-6 (H,K,M). Note that from about 24 hpf, the hindbrain ventricular zone has a characteristic T-shape, where ventral is located ventromedially and dorsal is located dorsolaterally. Embryos are shown with anterior to the left in lateral (A,B,O) or dorsal (C-N) view. (P-S) Transverse sections of the hindbrain at the level of the otic vesicle were analysed for GS (green) and GFAP (red) at 72 hpf (P) or HuC at 120 hpf (R). The framed areas in P and R are shown at higher magnification in Q and S, respectively. Scale bar: 50 μm.