
|
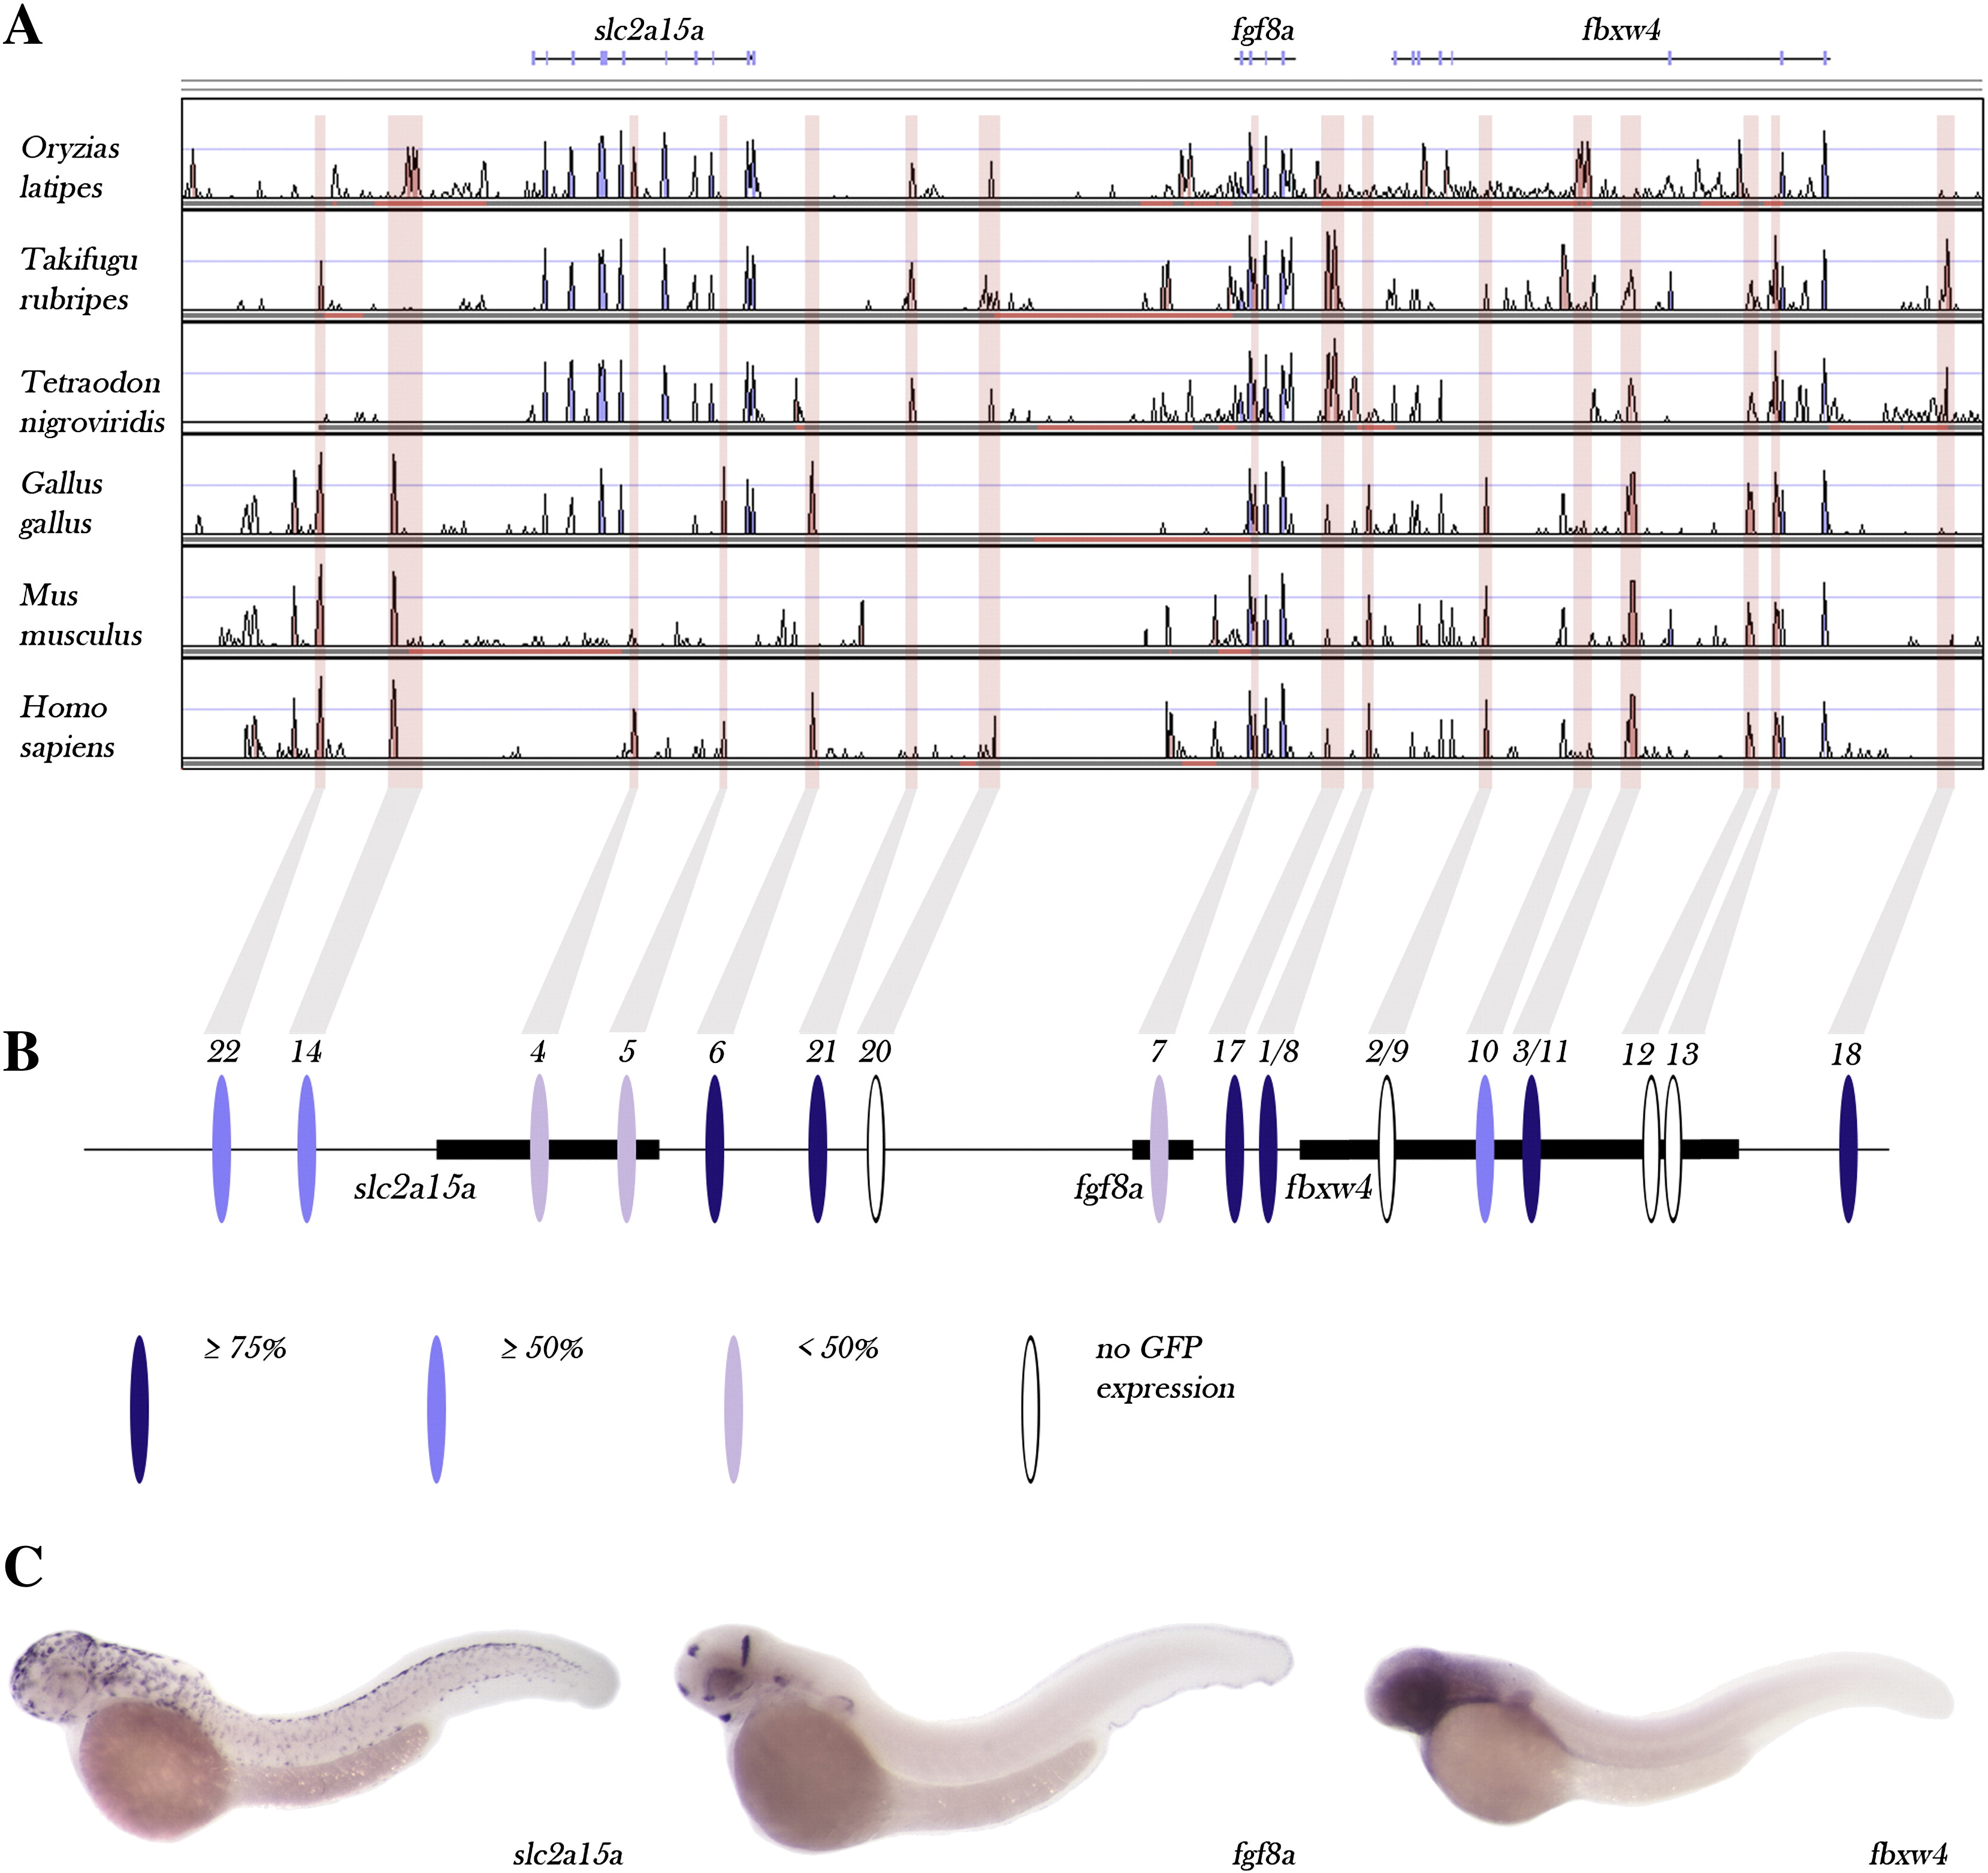
Fig. 3 Overview of regulatory sequences tested in the zebrafish fgf8a locus. (A) Vista plot of zebrafish (as the base genome) with multiple vertebrate genomes, names on the left. Boxed elements correspond to the oval elements in B. The black bars indicate genes and the ovals the tested CNEs. White ovals indicate elements that did not exhibit enhancer activity. The intensity of blue ovals shows various levels of regulatory specificity of CNEs: navy blue—highly specific, reproducible elements (at least 75% of transgenic lines shown the same pattern); medium blue—elements which show a main, specific pattern with extra variable domains (more than 50% reproducibility); purple—elements which drove variable expression pattern with less than 50% reproducibility. (C) In situ hybridization patterns of zebrafish fgf8a and the two adjacent bystander genes slc2a15a and fbxw4 at day 2 of development. Substantial differences can be noticed in the expression pattern of these genes: specific and highly restricted expression of fgf8a, ubiquitously expressed fbxw4 and skin expression of slc2a15a. Anterior is to the left.
Reprinted from Developmental Biology, 336(2), Komisarczuk, A.Z., Kawakami, K., and Becker, T.S., Cis-regulation and chromosomal rearrangement of the fgf8 locus after the Teleost/tetrapod split, 301-312, Copyright (2009) with permission from Elsevier. Full text @ Dev. Biol.