
|
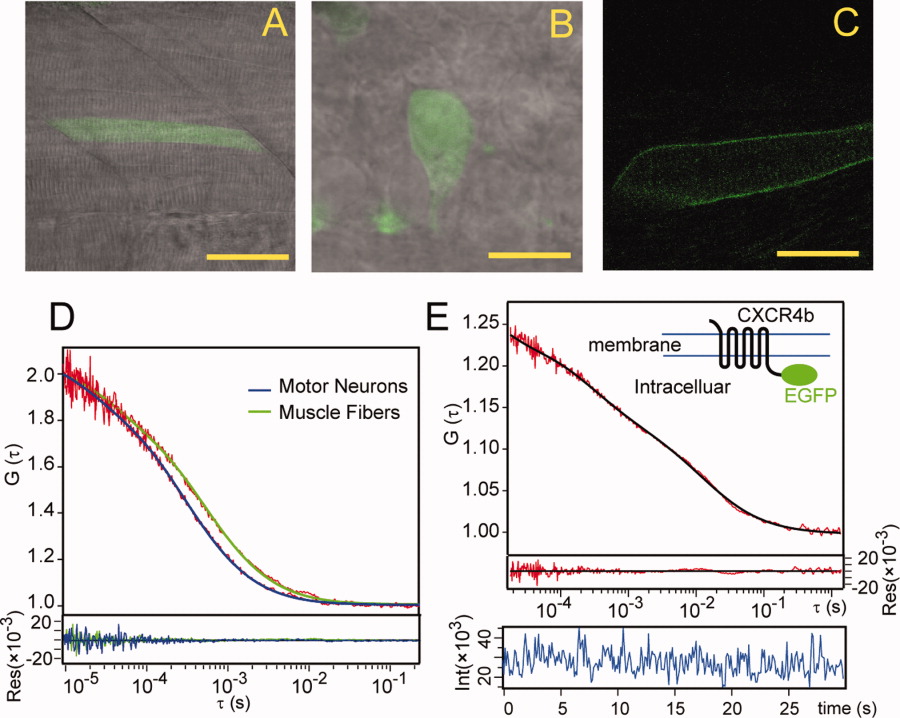
Fig. 5 Diffusion coefficient measurements in zebrafish embryos. A,B: Confocal images of enhanced green fluorescent protein (EGFP) expressed muscle fibers (at posterior trunk region) and motor neurons (at hindbrain/spinal cord junction region), respectively. Lateral view. C: Confocal image of Cxcr4b-EGFP-expressing muscle fiber, membrane expression pattern was observed. D: Normalized autocorrelation curves of cytosolic EGFPs in muscle fibers and motor neurons. E: Autocorrelation and fitting curves of Cxcr4b-EGFP on membrane of muscle fibers, together with fitting residuals and fluorescence intensity trace. The inset is a schematic drawing of the construct. Scale bars = 40 μm in A, 10 μm in B, 20 μm in C.