
Image
|
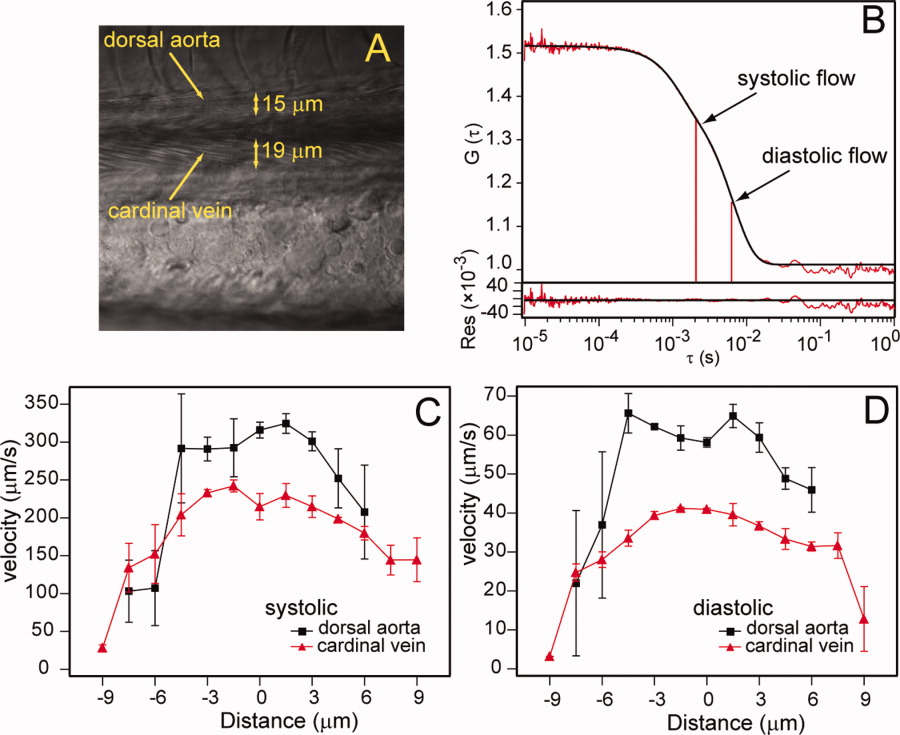
Figure Caption
Fig. 4 Blood flow measurements in live zebrafish embryos. A: Confocal image of the dorsal aorta and cardinal vein, 3 days postfertilization (dpf) AB, lateral view. B: A typical FCS flow measurement in the cardinal vein, showing both experimental curve (red) and fitting curve (black). At the bottom are the residuals of the fit. Experimental curves are fitted with a two flow model representing systolic and diastolic flow. C,D: Blood flow velocity profiles of systolic and diastolic flow, respectively. Results show measurements taken in the dorsal aorta (black) and cardinal vein (red).
Acknowledgments
This image is the copyrighted work of the attributed author or publisher, and
ZFIN has permission only to display this image to its users.
Additional permissions should be obtained from the applicable author or publisher of the image.
Full text @ Dev. Dyn.