
|
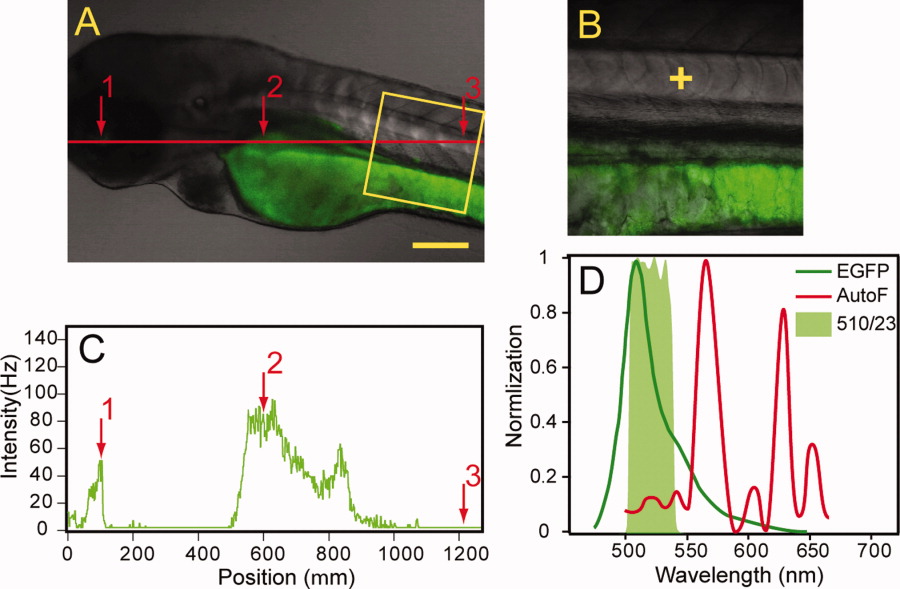
Fig. 1 Zebrafish embryo autofluorescence study. A: Overview of autofluorescence expression in lateral view 3 days postfertilization (dpf) AB wild-type embryo, excited with 100 μW 488-nm laser, long-pass 505 as emission filter. Overlay of transmission and fluorescence channel. The embryo was treated with PTU at 18 hpf to prevent pigmentation. B: Enlarged view of the square region in A. C: Fluorescence intensity trace of the red line in A. D: Normalized autofluorescence spectrum taken in the trunk region (yellow cross in B), shown together with enhanced green fluorescent protein (EGFP) fluorescence spectrum and 510AF23 emission filter. Scale bar = 200 μm.