
|
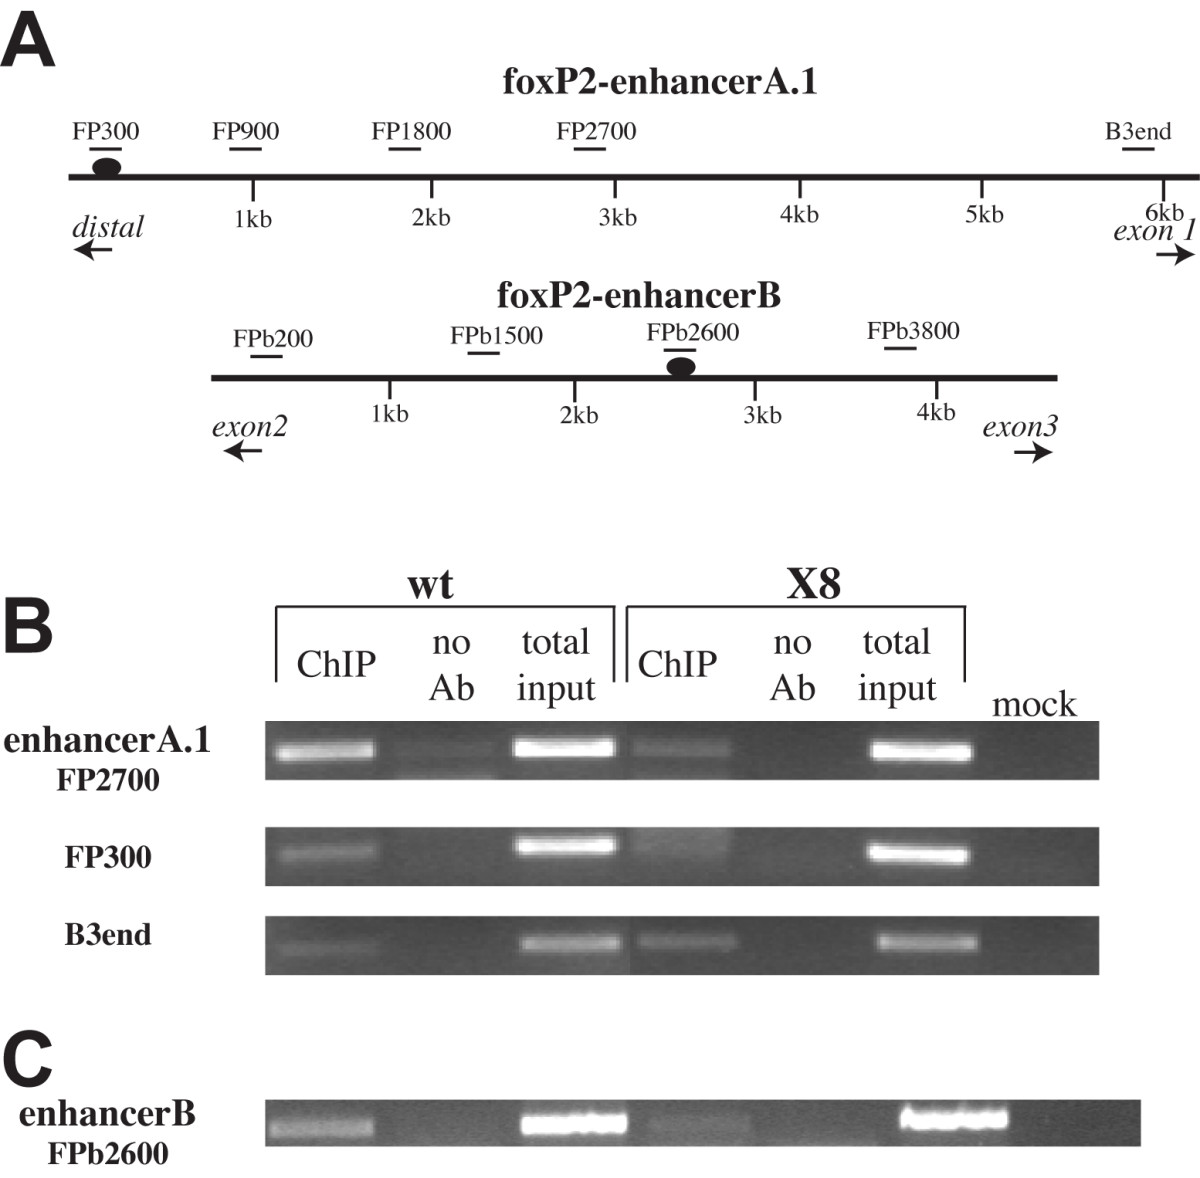
Fig. 7 ChIP analysis of foxP2-enhancerA.1 and foxP2-enhancerB genomic regions at 30 hpf. (A) Diagram of foxP2-enhancerA.1 and foxP2-enhancerB regions. PCR amplicon locations and names are indicated above the genomic region; predicted Lef1 binding sites are shown as ovals. (B) Agarose gel analysis of ChIP PCR for foxP2-enhancerA.1, showing the PCR products for FP2700, FP300, and B3end. In wild type (wt) embryos, ChIP shows significant enrichment of the FP2700 product and slight enrichment of the FP300 product, compared to both the no antibody (Ab) control, and the ChIP of homozygous Df(LG01)x8 embryos (Mock: water control for the PCR reaction.) In contrast, the B3end product showed no enrichment relative to the Df(LG01)x8 embryos. (C) Agarose gel analysis of ChIP PCR for foxP2-enhancerB, showing the FPb2600 PCR product. In wt embryos, ChIP shows significant enrichment of the FPb2600 product, compared to both the no antibody and homozygous Df(LG01)x8 controls.