
Image
|
Figure Caption
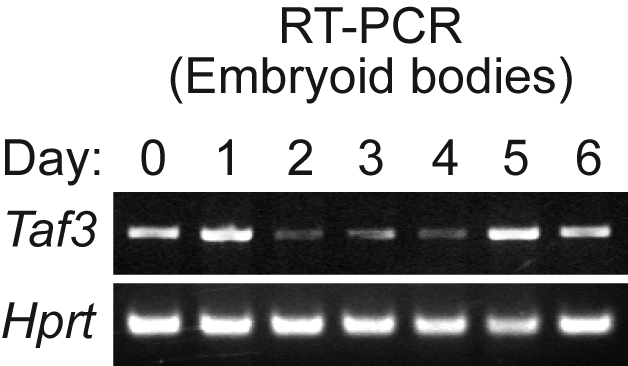
Fig. S5
Taf3 is expressed at a relatively constant level during differentiation in embryoid bodies. RT-PCR analysis monitoring expression of Taf3 in mouse embryoid bodies at the indicated times (days) following induction of differentiation. Expression of Hprt was monitored as a loading control. {FIGS6}
Acknowledgments
This image is the copyrighted work of the attributed author or publisher, and
ZFIN has permission only to display this image to its users.
Additional permissions should be obtained from the applicable author or publisher of the image.
Full text @ Dev. Dyn.